
Fig. 1
- ID
- ZDB-FIG-160516-1
- Publication
- Ando et al., 2016 - Clarification of mural cell coverage of vascular endothelial cells by live imaging of zebrafish
- Other Figures
- All Figure Page
- Back to All Figure Page
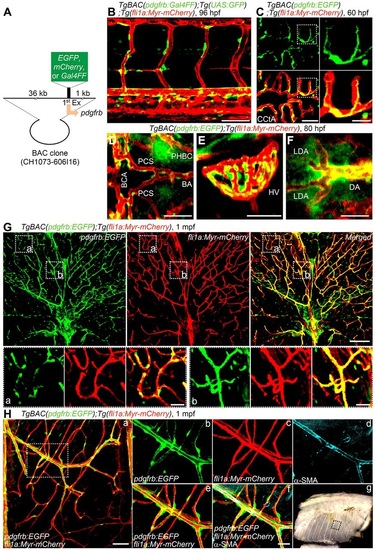
Generation of Tg zebrafish lines for live imaging of MCs. (A) A schematic structure of the BAC clone (CH1073-606I16) used to generate Tg zebrafish lines for live imaging of MCs. cDNA encoding either EGFP, mCherry or Gal4FF was inserted at the start codon of pdgfrb gene. (B) Confocal stack fluorescence image of trunk vasculature in a 96hpf TgBAC(pdgfrb:Gal4FF);Tg(UAS:GFP);Tg(fli1a:Myr-mCherry) larva. Lateral view, anterior to the left. Merged image of pdgfrb:Gal4FF;UAS:GFP (green) and fli1a:Myr-mCherry (red). (C-F) Confocal images of hindbrain vasculature (C,D), hyaloid vessels (E) and anterior region of dorsal aorta (F) in the TgBAC(pdgfrb:EGFP);Tg(fli1a:Myr-mCherry) larvae at 60hpf (C) and 80hpf (D-F). Dorsal view, anterior to the left. Merged images of pdgfrb:EGFP (green) and fli1a:Myr-mCherry (red). In C, the boxed areas are enlarged to the right. (G) Confocal images of trunk vasculature in a 1mpf TgBAC(pdgfrb:EGFP);Tg(fli1a:Myr-mCherry) juvenile. Cross-sectional views (200µm thick) through the caudal region as depicted in Fig. S1H are shown. Upper left, pdgfrb:EGFP (green); upper center, fli1a:Myr-mCherry (red); upper right, merged image. The boxed areas labeled a and b are enlarged below. (H) Confocal images of blood vessels in the intercostal muscle of a 1mpf TgBAC(pdgfrb:EGFP);Tg(fli1a:Myr-mCherry) juvenile. Pleural tissue as indicated by the box shown in g was cut out and immunostained with anti-α-SMA antibody to visualize VSMCs. The merged image of pdgfrb:EGFP (green) and fli1a:Myr-mCherry (red) is shown on the left (a). The boxed area in a is enlarged to the right: pdgfrb:EGFP (b), fli1a:Myr-mCherry (c), α-SMA (d), merge of pdgfrb:EGFP (green) and fli1a:Myr-mCherry (red) (e) and merge of pdgfrb:EGFP (green), fli1a:Myr-mCherry (red) and α-SMA (blue) (f). (g) Brightfield image of the thorax showing the region where the image shown in a was taken. BA, basilar artery; BCA, basal communicating artery; CCtA, cerebellar central artery; DA, dorsal aorta; LDA, lateral DA; HV, hyaloid vessel; PCS, posterior communicating segment; PHBC, primordial hindbrain channel. Scale bars: 20µm (enlarged images in C and H; D-F); 50µm (B,C); 100µm (G,H). |