
Fig. S1
- ID
- ZDB-FIG-160516-7
- Publication
- Ando et al., 2016 - Clarification of mural cell coverage of vascular endothelial cells by live imaging of zebrafish
- Other Figures
- All Figure Page
- Back to All Figure Page
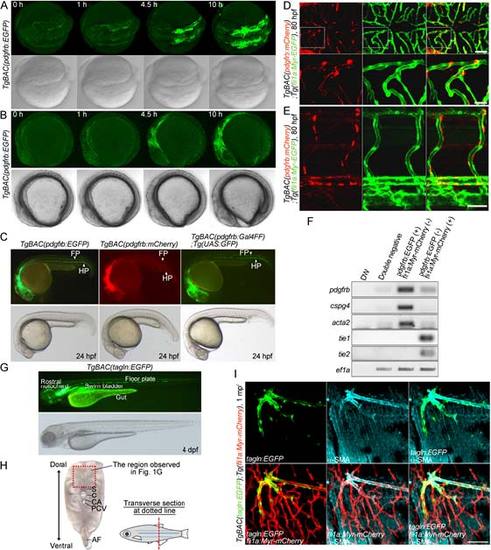
Characterization of TgBAC(pdgfrb:EGFP) and TgBAC(tagln:EGFP) zebrafish lines. (A, B) Time-lapse confocal images of the TgBAC(pdgfrb:EGFP) embryos from 8 somite stage. Dorsal (A) and lateral (B) view images at 8 somite stage (leftmost column) and their subsequent time-lapse images with the elapsed time (h) at the top. Upper, pdgfrb:EGFP; lower, bright field image. (C) Lateral views of TgBAC(pdgfrb:EGFP)(left), TgBAC(pdgfrb:mCherry)(center) and TgBAC(pdgfrb:Gal4FF);Tg(UAS:GFP)(right) zebrafish embryos at 24 hpf. Upper, pdgfrb:EGFP (left),pdgfrb:mCherry(center) and pdgfrb:Gal4FF;UAS:GFP(right); lower, bright field images. FP, floor plate; HP, hypochord. (D, E) Dorsal view of CtAs (D) and lateral view of trunk vessels (E) in the TgBAC(pdgfrb:mCherry);Tg(fli1a:Myr-EGFP) larvae at 80 hpf. Anterior to the left. Left; pdgfrb:mCherry, center; fli1a:Myr-EGFP, right; the merged images of pdgfrb:mCherry(red) and fli1a:Myr-EGFP(green). The boxed areas in D are enlarged at the bottom.(F) Expression of MC markers (pdgfrb, cspg4, and acta2), EC markers (tie1 and tie2) and ef1ain the EGFF and mCherry double-negative cells (Double negative), EGFP-positive and mCherry-negative cells (pdgfrb:EGFP(+), fli1a:Myr-mCherry (-)) and EGFP-negative and mCherry-positive cells (pdgfrb:EGFP (-), fli1a:Myr-mCherry (+)) isolated from the TgBAC(pdgfrb:EGFP);Tg(fli:Myr-mCherry) larvae by FACS at 7 dpf was analyzed by RT-PCR analyses. (G) Lateral view of the TgBAC(tagln:EGFP)zebrafish larva at 4 dpf. Upper, tagln:EGFP; lower, bright field image.(H) Transverse sectional image of caudal region of adult zebrafish. The boxed area indicates the region where the images shown in Figure 1G were taken. S, spinal cord; C, caudal vertebra; CA, caudal artery; PCV, posterior cardinal vein; AF, anal fin. (I) Confocal images of blood vessels in the intercostal muscle of the 1 mpf TgBAC(tagln:EGFP);Tg(fli1a:Myr-mCherry) juvenile. The pleural tissue was immunostained with anti-α-SMA antibodyto visualize VSMC, as in Fig.1H. tagln:EGFP(green), α-SMA (blue) and fli1a:Myr-mCherry (red) images are shown as indicated atthe bottom left corner of each image. Scale bars, 20 µm (enlarged image in D), 50 µm (D, E,I). |