
Fig. 3
- ID
- ZDB-FIG-160516-3
- Publication
- Ando et al., 2016 - Clarification of mural cell coverage of vascular endothelial cells by live imaging of zebrafish
- Other Figures
- All Figure Page
- Back to All Figure Page
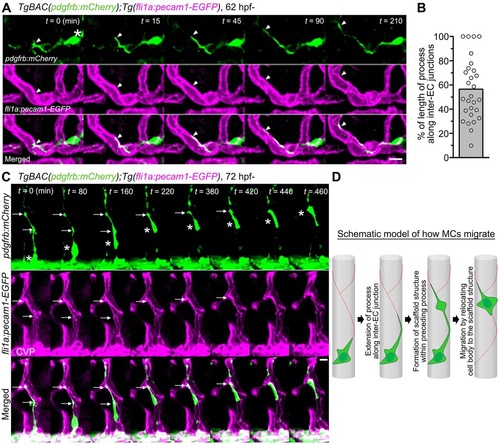
Migration of MCs along inter-EC junctions. (A) Time-lapse confocal images of an MC migrating along the CtA in the hindbrain of a TgBAC(pdgfrb:mCherry);Tg(fli1a:pecam1-EGFP) larva. 3D-rendered confocal images at 62hpf (leftmost column) and their subsequent time-lapse images with the elapsed time (min) at the top right. Top, pdgfrb:mCherry (green); middle, fli1a:pecam1-EGFP (magenta); bottom, merged images. Arrowheads and asterisk indicate the tip of the MC process and the cell body, respectively. Note that the MC extended a process along the Pecam1-EGFP-labeled inter-EC junctions. (B) Alignment of MC processes along inter-EC junctions, as observed in A, expressed as a percentage of the total length (n=28). Bar and circles indicate the average and the values of individual processes, respectively. (C) Time-lapse confocal images of an MC migrating along the CtA, as in A. 3D-rendered confocal images at 72hpf (leftmost column) and their subsequent time-lapse images with the elapsed time (min) at the top right. Note that the MC moved forward by sequentially relocating its cell body (asterisks) to the punctate structures formed within the preceding processes (arrows). CVP, choroidal vascular plexus. (D) Schematic of how MCs migrate along the EC tube to cover the CtA. Red lines indicate the inter-EC junctions, green cells represent MCs. Scale bars: 10µm (A,C). |
| Genes: | |
|---|---|
| Fish: | |
| Anatomical Terms: | |
| Stage Range: | Pec-fin to Protruding-mouth |