
Fig. S7
- ID
- ZDB-FIG-160516-13
- Publication
- Ando et al., 2016 - Clarification of mural cell coverage of vascular endothelial cells by live imaging of zebrafish
- Other Figures
- All Figure Page
- Back to All Figure Page
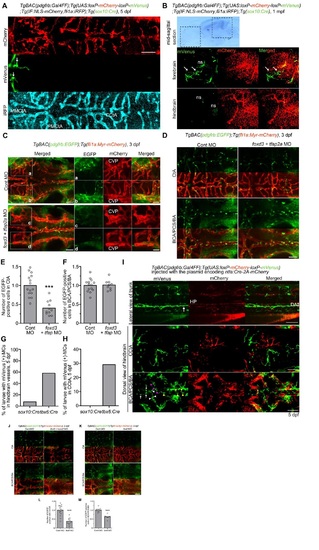
Investigation of the origin of the MCs in cranial vessels. (A) Confocal images of CtA in the TgBAC(pdgfrb:Gal4FF);Tg(UAS:loxP-mCherry-loxP-mVenus);Tg(IF:NLS-mCherry,fli1a:iRFP);Tg(sox10:Cre) larva at 5 dpf. The larvae expressing iRFP670 under the control of fli1a promoter was identified by intestinal fatty acid binding protein(IF) promoter-driven expression ofNLS-mCherry in the intestine. Dorsal view, anterior to the left. Top, mCherry; middle, mVenus; bottom, iRFP. Arrows indicate mVenus-positive MCs. Note that the mVenus-positive MCs existed in anterior part of MMCtA, but not in the PMCtA and CCtA, at 5 dpf. (B) Midsagittal section of brain of the TgBAC(pdgfrb:Gal4FF):Tg(UAS:loxP-mCherry-loxP-mVenus);Tg(IF:NLS-mCherry,fli1a:iRFP);Tg(sox10:Cre) juvenile at 1 mpf. Confocal images of forebrain (middlepanel) and hindbrain (bottom panel) indicated by the boxed areas in the bright field image (upper panel). Left, mVenus; center, mCherry; right, the merged images of mVenus (green) and mCherry (red). Arrows indicate mVenus-positive MCs. Note that the mVenus-positive MCs existed in the forebrain, but not in the hindbrain, at 1 mpf. ns indicates non-specific intrinsic fluorescence signal. (C) Confocal images of the vessels in the cerebral base in the 3 dpf TgBAC(pdgfrb:EGFP);Tg(fli1:Myr-mCherry) larvae injected with control MO (upper panels) or both foxd3 and tfap2a MOs (lower panels). Dorsal view, anterior to the left. The merged images of pdgfrb:EGFP(green) and fli1a:Myr-mCherry(red) are shown at the leftmost column. Boxed areas (a-d) are enlarged to the right, showing pdgfrb:EGFP(left), fli1a:Myr-mCherry(center) and the merged images of pdgfrb:EGFP(green) and fli1a:Myr-mCherry(red) (right). Note that pdgfrb:EGFP-positive cells around CVP were dramatically reduced in the foxd3/tfap2a-double morphant larvae. (D) Confocal images of CtA (upper two panel) and the vessels in the cerebral base (lower two panels, BCA/PCS/BA) in the 3 dpf TgBAC(pdgfrb:EGFP);Tg(fli1a:Myr-mCherry) larvae injected with control MO (left column) or both foxd3 and tfap2a MOs (right column). Dorsal view, anterior to the left. Upper, pdgfrb:EGFP; lower, the merged images of pdgfrb:EGFP(green) and fli1a:Myr-mCherry(red). (E, F) The number of EGFP-positive cells covering the CtA (E) or the BCA, PCS and BA (F), as observed in D. Data are expressed relative to the average of controls(n ≥ 9). (G,H) Percentage oflarvae showing mVenus-positive MCs covering the vessels in the hindbrain such as CCtA, BCA, PCS and BA (G) or in the CCtA (H) of the 5 dpf TgBAC(pdgfrb:Gal4FF):Tg(UAS:loxP-mCherry-loxP-mVenus)larvae crossed with Tg(sox10:Cre) (sox10:Cre)or Tg(tbx6:Cre,myl7:EGFP) (tbx6:Cre) fish line (sox10:Cre n=13, tbx6:Cre n=31). (I) Confocal images of trunk (upper panel; lateral view, anterior to the left) and head (middle (CCtA) and lower (BCA, PCS,and BA) panels; dorsal view, anterior to the left) regions in the 5 dpf TgBAC(pdgfrb:Gal4FF):Tg(UAS:loxP-mCherry-loxP-mVenus) larvae injected with the plasmid encoding ntla:Cre-2A-mCherry. Note that mVenus-positive MCs covered the ventral part of DA (arrow) in the trunk and the CCtA, BCA (white arrowheads), PCS (magenta arrowheads), BA (yellow arrowheads) and PMCtA (arrows) in the head. HP; hypochord. (J) Confocalimages of the CtA (upper two panels) and the vessels in the cerebral base (BCA/PCS/BA, lower two panels) in the 3 dpf TgBAC(pdgfrb:EGFP);Tg(fli1a:Myr-mCherry) larvae injected with control MO (left column) or both tbx6 and hand2 MOs (right column). Upper, pdgfrb:EGFP; lower, the merged images of pdgfrb:EGFP(green) and fli1a:Myr-mCherry(red). Note that tbx6/hand2-double morphant exhibited defective formation of hindbrain vessels. (K) Confocal images of the CtA and the vessels in the cerebral base in the 3 dpf TgBAC(pdgfrb:EGFP);Tg(fli1a:Myr-mCherry) larvae injected with control MO (left column) or tbx6 MO (right column) are shown, as in J. (L, M) The number of EGFP-positive cells covering the CtA (L) or the BCA, PCS and BA (M), as observed in K. Data are expressed relative to the average of controls(n ≥ 8). Bars and circles indicate averages and each value, respectively. Scale bars, 20 µm(enlarged images in C) or 50 µm(A-D, I-K). In E, F, Land M, bars and circles indicate averages and each value, respectively. In E, Land M, ***p<0.001, significant difference between two groups. |