
Fig. S5
- ID
- ZDB-FIG-160516-11
- Publication
- Ando et al., 2016 - Clarification of mural cell coverage of vascular endothelial cells by live imaging of zebrafish
- Other Figures
- All Figure Page
- Back to All Figure Page
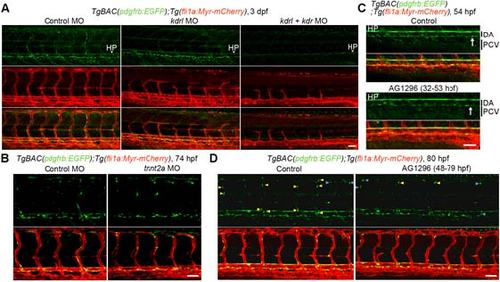
Developmental mechanism of MCsin the trunk vasculature. (A) Confocal images of trunk vasculature in the 3 dpf TgBAC(pdgfrb:EGFP);Tg(fli1a:Myr-mCherry) larvae injected with control MO (left), kdrlMO (center) or both kdrl and kdr MOs (right). Top, pdgfrb:EGFP; middle, fli1a:Myr-mCherry(red); bottom, the merged images of pdgfrb:EGFP(green) and fli1a:Myr-mCherry(red). (B) Confocal images of trunk vasculature in the 3 dpfTgBAC(pdgfrb:EGFP);Tg(fli1a:Myr-mCherry) embryo injected with control MO (left) or tnnt2aMO (right). Upper, pdgfrb:EGFP; lower, the merged images of pdgfrb:EGFP(green) and fli1a:Myr-mCherry(red). (C, D) Confocal images of trunk vasculature in the54 hpf (C) or 80 hpf (D)TgBAC(pdgfrb:EGFP);Tg(fli1a:Myr-mCherry)larvae treated with vehicle or 20 µM AG1296 during 32-53 hpf (C) or 48-79 hpf (D). Upper, pdgfrb:EGFP; lower, the merged images of pdgfrb:EGFP(green) and fli1a:Myr-mCherry(red). Arrows in C indicate the EGFP-positive cells beneath the DA. Yellow and blue arrowheadsin Dindicate the EGFP-positive cells covering aISVs and those covering vISVs, respectively. In this figure, all images are shown in lateral view with anterior to the left. Scale bars, 20 µm (enlarged image in A) or 50 µm (A-D).DA, dorsal aorta; PCV, posterior cardinal vein; HP, hypochord. |