
Fig. S2
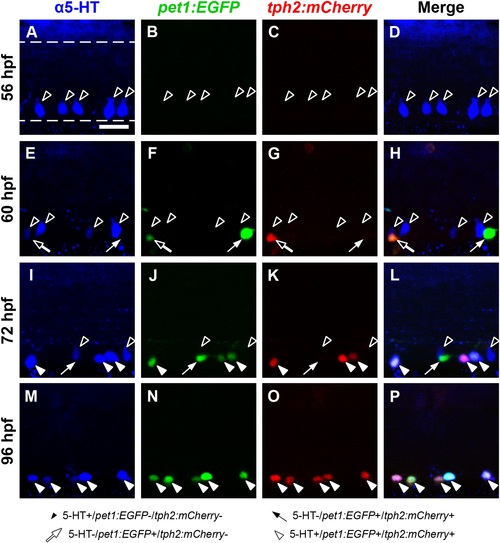
Spinal 5-HT immunoreactivity precedes both pet1:EGFP and tph2:mCherry transgene expression, and later becomes restricted to cells that coexpress pet1:EGFP and tph2:mCherry. Wholemount Tg(-3.2pet1:EGFP)ne0214 and Tg(tph2:nfsB-mCherry)y226 double transgenic larvae were labeled with antibodies to 5-HT (blue) and confocal images were collected from the midbody region of the spinal cord (dashed lines in A represent the dorsal and ventral boundaries of the spinal cord, approximately same position in all panels). Black arrowheads indicate cells that are 5-HT+ but did not express either transgene, white arrows indicate cells that were positive for only pet1:EGFP expression (green), black arrows indicate a cell that coexpressed pet1:EGFP and tph2:nfsB-mCherry (tph2:mCherry; red) but did not contain 5-HT, and white arrowheads indicate cells that were positive for all three markers. A-D: Antibodies to 5-HT revealed cells in the ventral 48 hpf spinal cord (A, black arrowheads) before pet1:EGFP (B) or tph2:mCherry (C) expression was detected (merge in D). E-H: At 60 hpf, 5-HT antibody labeling (E) that did not overlap with pet1:EGFP (F) or tph2:mCherry (G) expression persisted (black arrowheads). 5-HT- cells that expressed only pet1:EGFP (white arrows) or coexpressed pet1:EGFP and tph2:mCherry (black arrows) were observed in the ventral spinal cord (merge in H). I-L: At 72 hpf, pet1:EGFP+ cells (J) colabeled with tph2:mCherry expression (K) and 5-HT (I, white arrowheads), although a portion did not colabel (white arrow). 5-HT antibody labeling continued, but was reduced in cells that did not express either transgene (black arrowheads). M-P: By 96 hpf, 5-HT antibody labeling (M) was restricted to cells that coexpressed pet1:EGFP (N) and tph2:mCherry (O, merge in P, white arrowheads). Because pet1:EGFP was expressed in cells that did not coexpress tph2:mCherry (H and L, white arrows), but tph2:mCherry was only detected in pet1:EGFP+ cells (H, L, and P, black arrows and white arrowheads), expression from the pet1 promoter likely preceded expression from the tph2 promoter. Further, 5-HT was detected in cells that coexpressed both transgenes (L and P, white arrowheads) and not in cells that expressed only pet1:EGFP (H and L, white arrows). This suggested that 5-HT synthesis occurred after tph2:mCherry expression. Scale bar = 20 µm. |