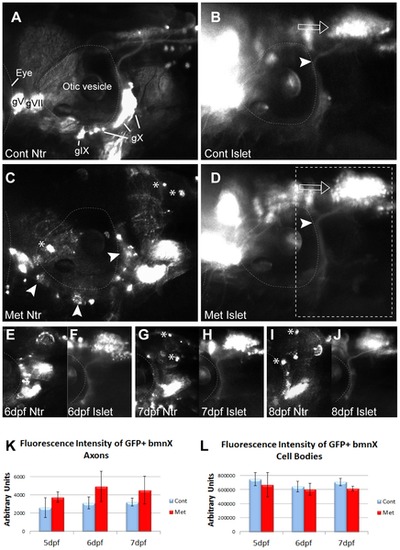
A,B) 4:gfp;Ntr incubated in fish water (control) for 18 h and imaged at 5 dpf. A) Ntr-expressing sensory neurons. B) Isl1:gfp-expressing branchiomotor neurons (bmn). Arrowhead indicates axons; open arrow indicates motor cell bodies in hindbrain. C,D) 4 dpf Isl1:gfp;Ntr treated with 10 mM Met for 18 h and imaged at 5 dpf. C) Ntr-expressing sensory neurons/axons degenerate. Arrowheads point to degenerating cell bodies; asterisks indicate mCherry-containing debris. D) Isl1:gfp-expressing bmn remain intact while sensory neurons contributing to the same nerve degenerate. Open arrow points to motor neuron cell bodies; arrowhead indicates motor axons. Outlined box indicates region of focus in E–J. E–J) 4 dpf Islet:gfp;Ntr kept in 10 mM Met and imaged for 3 consecutive days. E) 6 dpf Ntr; F) 6 dpf Isl1:gfp; G) 7 dpf Ntr; H) 7 dpf Isl1:gfp; I) 8 dpf Ntr; J) 8 dpf Isl1:gfp. Water changes containing fresh Met were performed each day after imaging. Asterisks indicate some of the debris containing mCherry seen after Met-treatment. Met had no significant effect on Islet-expressing bmn, while Ntr-expressing sensory neurons contributing to the same nerve degenerated. K,L) Quantitation of fluorescence intensity of isl1:gfp bmn axons (K) and cell bodies (L) from individual larvae maintained in 10 mM Met for 3 days showed no change in fluorescence during peripheral sensory axon degeneration. Fluorescence intensity was quantitated using ImageJ, with the same region of interest used for each analysis. Integrated density, area, mean and background fluorescence were measured and from these values, corrected total cell fluorescence (given in arbitrary units) was calculated (n = 3 larvae/treatment group) and analyzed (t-test). Eye is outlined in A–D, otic vesicle outlined in all panels. Cranial ganglia labeled gV, gVII, gIX and gX. Anterior to left, dorsal at top for all panels.