
Fig. 9
- ID
- ZDB-FIG-141023-36
- Publication
- Pope et al., 2014 - Peripheral glia have a pivotal role in the initial response to axon degeneration of peripheral sensory neurons in zebrafish
- Other Figures
- All Figure Page
- Back to All Figure Page
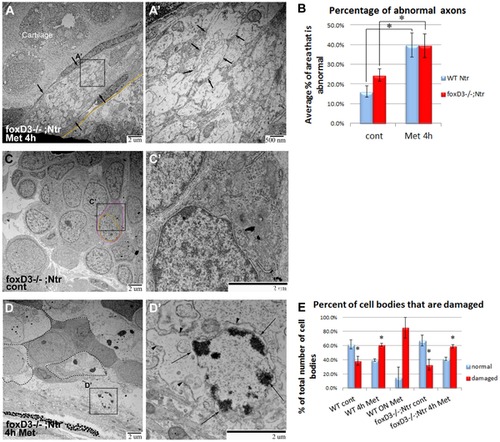
TEM images of axons and ganglia in 4/Ntr larvae. A,A′) Axons after 4) Cross section of axon bundle (arrows) (7500x). Membrane dividing brain and periphery (basement membrane) highlighted orange in all images. A′) Higher magnification (30,000x) of A. Individual axons (arrows) have abnormal appearance and broken membranes (compare to Figures 7C′ and 4D′). B) Quantitation of axon damage (given as percent of total axon area damaged) in Ntr and FoxD3-/-;Ntr. Damage in Ntr significantly increased from 16.2% (±2.84%, n = 10) in untreated to 39.9% (±6.08%, n = 5) with 4 hr Met treatment (p<0.01). In mutants, damage increased significantly from 24.53% (±3.19%, n = 7) in untreated to 39.48% (±5.97%, n = 3) in 4 hr Met-treated larvae (p<0.01). C,C′) Ganglia in untreated FoxD3-/-;Ntr (nucleus in orange; cytoplasm in magenta). C) Ganglia appear normal at low magnification (7500x) (nucleus in orange; cytoplasm in magenta; compare to Figure 5A). C′) Higher magnification (15,000x) shows normal cell body without surrounding glia. D,D′) Ganglia in FoxD3-/-;Ntr treated with 10 mM Met for 4 hr. D) Damaged cell bodies (outlined) are apparent at this magnification (7500x). D′) Higher magnification (15,000x) of degenerating cell. Nucleus has distinctive chromatin clumps (arrows). Cytoplasm contains damaged organelles and broken, irregular cell membranes (arrowheads, compare to Figure 5B′). E) Quantitation of Met-induced cell body damage in wild type Ntr and FoxD3-/-Ntr. Graph shows percent of normal versus damaged soma in wild type control (normal 61.7%±6.5%; damaged 38.3%±6.5%, n = 5, p<0.05), 4 h Met (normal 39.2%±2.0%; damaged 60.8%±2.0%, n = 5, p<0.05), 18 hr Met (normal 14.9%±14.9%; damaged 85.1%±14.9%, n = 2, ns), mutant control (normal 67.2%±7.8%; damaged 32.8%±7.8%, n = 2, p<0.05), and mutant 4 hr Met (normal 41.2%±2.5%; damaged 58.8%±2.5%, n = 3, p<0.05). Met treatment significantly increased the number of degenerating cells in wild type and mutant larvae after 4 hr Met treatment. |
| Fish: | |
|---|---|
| Condition: | |
| Observed In: | |
| Stage: | Day 4 |