
Fig. S3
- ID
- ZDB-FIG-141107-2
- Publication
- Pope et al., 2014 - Peripheral glia have a pivotal role in the initial response to axon degeneration of peripheral sensory neurons in zebrafish
- Other Figures
- All Figure Page
- Back to All Figure Page
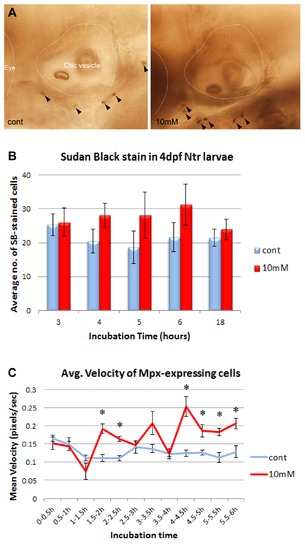
Neutrophil response to degenerating neurons in 4 dpf Ntr larvae. A) Sudan Black staining of Ntr treated with fish water (control) or 10 mM Met for 4 hr, (neutrophils labeled with arrowheads). B) SB-stained cell counts in larvae treated with control or 10 mM Met for various times. Average number of SB-stained cells/fish per treatment group shown for incubation times of 3 h (control 25.31±3.81, n = 16; Met 26.00±4.19, n = 17), 4 h (control 20.47±3.55, n = 17; Met 28.12±3.49, n = 17), 5 h (control 18.67±4.84, n = 6; Met 28.17±6.79, n = 6), 6 h (control 21.67±4.36, n = 6; Met 31.17±6.06, n = 6), and 18 h (control 21.55±2.55, n = 11; Met 23.92±2.95, n = 12). None were statistically significant. C) Neutrophil movement in Mpx:gfp;Ntr larvae treated with fish water or 10 mM Met. Graph shows average velocity (pixels/sec) of neutrophils over time: 0–0.5 h (control 0.165±0.008, n = 44; Met 0.152±0.017, n = 42, ns), 0.5–1 h (control 0.149±0.018, n = 15; Met 0.144±0.013, n = 32, ns), 1–1.5 h (control 0.112±0.007, n = 19; Met 0.075±0.023, n = 4, ns), 1.5–2 h (control 0.111±0.010, n = 17; Met 0.192±0.012, n = 93, p<0.05), 2–2.5 h (control 0.110±0.007, n = 51; Met 0.164±0.006, n = 64, p<0.05), 2.5–3 h (control 0.141±0.017, n = 23; Met 0.147±0.009, n = 50, ns), 3–3.5 h (control 0.137±0.011, n = 24; Met 0.207±0.032, n = 53, ns), 3.5–4 h (control 0.122±0.005, n = 51; Met 0.123±0.013, n = 24, ns), 4–4.5 h (control 0.124±0.008, n = 51; Met 0.253±0.027, n = 91, p<0.05), 4.5–5 h (control 0.126±0.006, n = 44; Met 0.187±0.017, n = 33, p<0.05), 5–5.5 h (control 0.113±0.014, n = 24; Met 0.183±0.010, n = 60, p<0.05), and 5.5–6 h (control 0.129±0.017, n = 30; Met 0.206±0.015, n = 36, p<0.05). Anterior is to the left; dorsal is at the top in all panels. Eye and otic vesicle (OV) are outlined. |