
Fig. 4
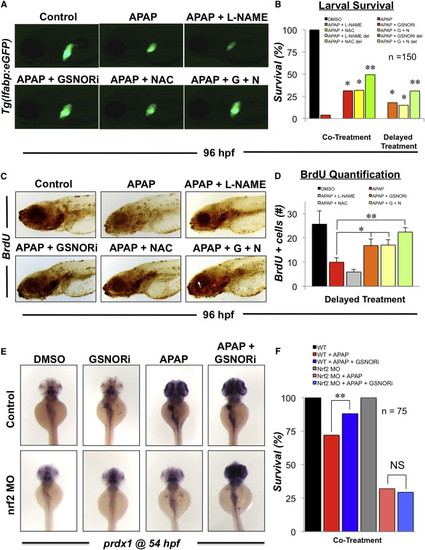
GSNOR Inhibition Is Hepatoprotective and Enhances Survival in Embryos Exposed to APAP via Activation of the Nrf2 Pathway (A) Effect of GSNORi and NAC on recovery from APAP-induced liver injury in Tg(lfabp:GFP) embryos. Tg(lfabp:GFP) embryos were exposed to a sublethal dose of APAP (5 mM) from 48 to 60 hpf at which point embryos were washed and subsequently exposed to GSNORi (1 μM) and/or NAC (10 μM) from 60 to 96 hpf. Representative fluorescent photomicrographs were taken at 10× magnification. (B) Survival in embryos exposed to a lethal dose of APAP (10 mM) from 48 to 96 hpf in the presence or absence of L-NAME (10 μM), GSNORi (1 μM), and NAC (10 μM). Under some conditions treatments were given after a 12 hr delay (del). n = 150; Fisher’s exact test, p < 0.001 compared to APAP alone, p < 0.001 compared to APAP + NAC. (C) Effect of GSNORi and NAC on proliferation following APAP-induced liver injury. Embryos were exposed to a sublethal dose of APAP (5 mM) from 48 to 60 hpf at which point embryos were washed and subsequently exposed to GSNORi (1 μM) and/or NAC (10 μM) from 60 to 96 hpf. Embryos were pulsed for 10 min in 10 mM BrdU just prior to fixation. Representative photomicrographs were taken at 10× magnification. (D) Quantification of BrdU positive cells in the regenerating liver of APAP exposed embryos exposed to GSNORi and/or NAC. n = 6; ANOVA, p < 0.05, p < 0.001 in comparison to APAP alone. (E) Effect of GSNORi (1 μM) and/or APAP (5 mM) exposure from 48 to 54 hpf on induction of the Nrf2 target gene, prdx1, as determined by in situ hybridization. Translation blocking ATG morpholino against nrf2 was injected at a concentration of 50 μM. (F) Survival in WT embryos and nrf2 morphants exposed to a lethal dose of APAP (10 mM) from 48 to 80 hpf in the presence or absence of GSNORi (1 μM). n = 75; Fisher’s exact test, p = 0.012. Results in (D) show mean ± SEM. |
| Genes: | |
|---|---|
| Fish: | |
| Condition: | |
| Knockdown Reagent: | |
| Anatomical Term: | |
| Stage Range: | Long-pec to Day 4 |
| Fish: | |
|---|---|
| Condition: | |
| Knockdown Reagent: | |
| Observed In: | |
| Stage Range: | Protruding-mouth to Day 4 |