
Fig. 5
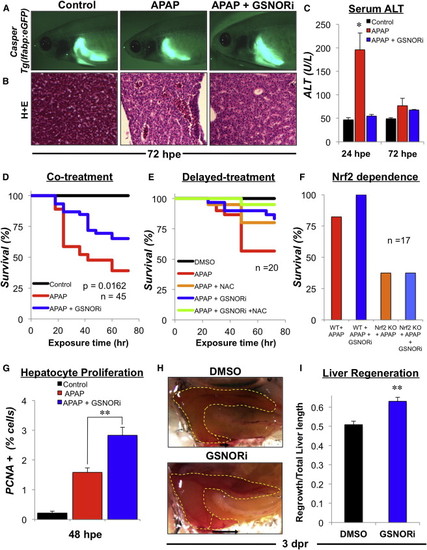
GSNOR Inhibition Protects Adult Zebrafish from APAP-Induced Toxicity and Enhances Regeneration following Liver Injury (A) In vivo fluorescent imaging of the liver in adult casper Tg(lfabp:GFP) fish exposed to 10 mM APAP for 18 hr before being exposed to GSNORi (1 μM). Adult fish were anaesthetized at 72 hpe and immediately imaged by fluorescent microscopy. Representative fluorescent photographs were taken at 10× magnification. (B) Hepatic histology (H&E) in fish exposed to APAP (10 mM) in the presence or absence of GSNORi (1 μM) at 48 hpe. (C) Serum alanine aminotransferase (ALT) activity in fish exposed to APAP (10 mM) in the presence or absence of GSNORi (1 μM) at 24 or 72 hpe. n = 6; ANOVA, p < 0.05 in comparison to control. (D) Kaplan-Meier plot of survival in adult fish exposed to APAP (10 mM) for 24 hr in the presence or absence of GSNORi (1 μM). Chemicals were removed 24 hpe, fish were reintroduced into fresh water and survival was monitored over 72 hr. n = 45; Kaplan-Meier estimate, p = 0.0162, Cox regression hazard ratio (HR) = 1.95. (E) Kaplan-Meier plot of survival in adult fish exposed to APAP (10 mM) for 18 hr followed by a delayed treatment with GSNORi (1 mM) and/or NAC (10 mM). n > 20 fish per treatment. (F) Survival in adult WT fish and Nrf2 mutant fish exposed to APAP (10 mM) in the presence or absence of GSNORi (1 μM) for 18 hr. n > 17 fish per treatment. (G) Hepatocyte proliferation was determined by immunohistochemical staining of PCNA positive hepatocytes in liver sections from WT fish exposed to APAP (10 mM) followed by delayed treatment with GSNORi (1 μM) at 48 hpe. n = 10; ANOVA, p < 0.001. (H) Liver regeneration following partial hepatectomy in adult zebrafish at 3 days post resection (dpr). Adult fish were exposed to DMSO or GSNORi (1 μM) 6 hr after surgery for 24 hr. Representative en bloc dissection photographs were taken at 2.5× magnification. (I) Quantification of liver regeneration as determined by the length of regrowth from the resection margin divided by the total length of the inferior lobe. n = 20; ANOVA, p < 0.001 in comparison to control. Results in (C), (G), and (I) show mean ± SEM. |
| Gene: | |
|---|---|
| Fish: | |
| Condition: | |
| Anatomical Term: | |
| Stage: | Adult |
| Fish: | |
|---|---|
| Condition: | |
| Observed In: | |
| Stage: | Adult |