
- Title
-
S-Nitrosothiol Signaling Regulates Liver Development and Improves Outcome following Toxic Liver Injury
- Authors
- Cox, A.G., Saunders, D.C., Kelsey, P.B., Conway, A.A., Tesmenitsky, Y., Marchini, J.F., Brown, K.K., Stamler, J.S., Colagiovanni, D.B., Rosenthal, G.J., Croce, K.J., North, T.E., and Goessling, W.
- Source
- Full text @ Cell Rep.
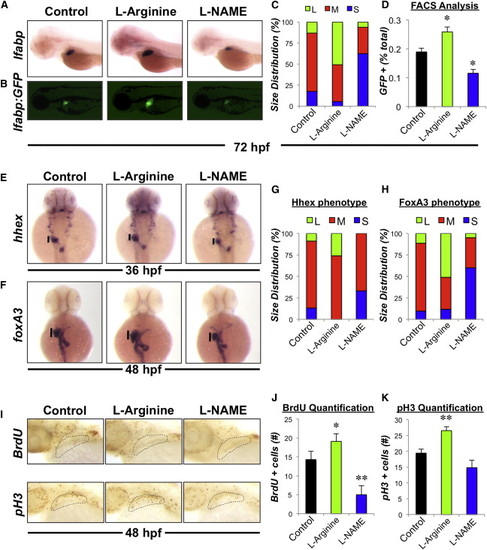
NO Signaling Regulates Liver Size during Development in Zebrafish (A) Effect of chemical modulators of NO signaling on liver formation. Zebrafish were exposed to chemicals (10 μM) from 24 to 72 hpf and subjected to in situ hybridization for the hepatocyte gene lfabp. Representative photomicrographs were taken at 10× magnification. (B) Effect of drug treatment on liver size in Tg(lfabp:GFP) embryos. Representative fluorescent photomicrographs were taken at 10× magnification. (C) Phenotypic analysis of liver size as determined by lfabp in situ hybridization in treated embryos at 72 hpf (S, small; M, medium; L, large, n > 50 embryos per treatment). (D) Effect of drug treatment on the percentage of hepatocytes specified during liver formation. Chemically treated Tg(lfabp:GFP) embryos were dissociated and the percentage of GFP positive hepatocytes was analyzed by fluorescence-activated cell sorting (FACS). n = 4; ANOVA, p < 0.05 in comparison to control. (E and F) Effect of drug treatment on hepatic progenitor cells. Zebrafish embryos were exposed to chemicals (10 μM) from 18 to 36 hpf or 24–48 hpf and subjected to in situ hybridization for the endodermal genes hhex and foxA3, respectively. (G and H) Phenotypic analysis of hepatic bud size as determined by hhex and foxA3 in situ hybridization in treated embryos at 36 and 48 hpf, respectively (n > 25 embryos per treatment). (I) Effect of drug treatment on hepatic progenitor cell proliferation as determined by BrdU incorporation or pH 3 staining, respectively. (J and K) Quantification of hepatic progenitor cell proliferation. Representative photomicrographs were taken and cell counts were performed. n = 10; ANOVA, p = 0.042, p < 0.001 in comparison to control. Results in (D), (J), and (K) show mean ± SEM. EXPRESSION / LABELING:
PHENOTYPE:
|
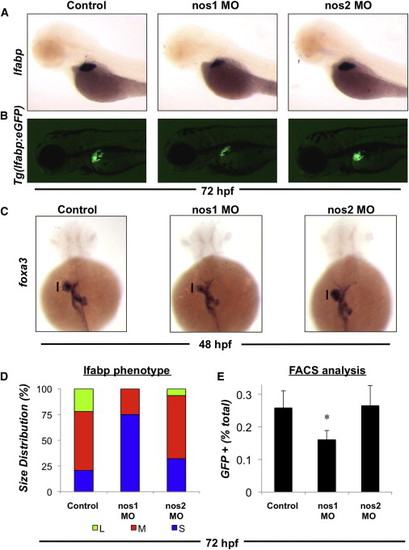
Constitutive NOS Activity Is Required for Optimal Liver Development (A) Effect of morpholino-mediated knockdown of nos1 and nos2 gene expression on liver formation as assessed by in situ hybridization for lfabp at 72 hpf. Translation blocking ATG morpholinos against nos 1 and 2 were injected at a concentration of 50 μM. Representative photomicrographs were taken at 10× magnification. (B) Effect of nos knockdown on liver size in Tg(lfabp:GFP) embryos. Representative fluorescent photomicrographs were taken at 10× magnification. (C) Effect of nos knockdown on hepatic progenitor cells as assessed by in situ hybridization for foxA3 at 48 hpf. Representative photomicrographs were taken at 10× magnification. (D) Phenotype analysis of liver size (lfabp) in morphants at 72 hpf (n > 50 embryos per treatment). (E) Effect of nos knockdown on the percentage of hepatocytes specified during liver formation. Tg(lfabp:GFP) morphants were dissociated, and the percentage of GFP positive hepatocytes was analyzed by FACS. n = 8; ANOVA, p = 0.033 in comparison to control. Results in (E) show mean ± SEM. EXPRESSION / LABELING:
PHENOTYPE:
|
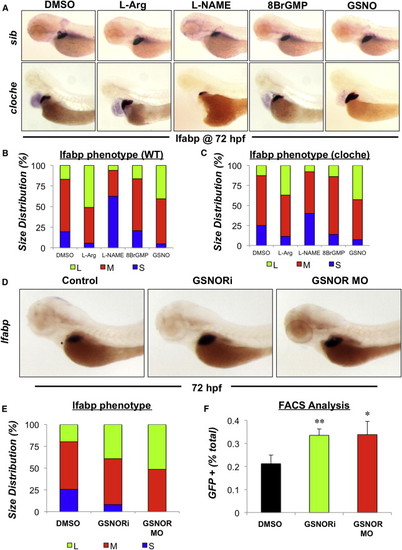
NO Signaling Regulates Liver Size in a cGMP-Independent Manner Involving Modulation of S-Nitrosothiol Homeostasis (A) Effect of chemical modulators of NO signaling on liver formation in cloche mutants that lack a vasculature. Cloche mutants and siblings (sib) were exposed to chemicals (5 μM) from 24 to 72 hpf and subjected to in situ hybridization for the hepatocyte gene lfabp. Representative photomicrographs were taken at 10× magnification. (B and C) Phenotype analysis of liver size in WT and cloche mutants exposed to the cGMP analog, 8BrGMP (10 μM), or the S-nitrosothiol GSNO (10 μM) from 24 to 72 hpf as determined by in situ hybridization for lfabp (n > 25 embryos per treatment). (D) Effect of chemical inhibition or morpholino-mediated knockdown of GSNOR on liver size as determined by in situ hybridization for the hepatocyte gene lfabp at 72 hpf. The translation blocking ATG morpholino against GSNOR was injected at a concentration of 50 ¼M. Representative photomicrographs were taken at 10× magnification. (E) Phenotype analysis of liver size in GSNOR-deficient embryos at 72 hpf as determined by in situ hybridization for lfabp (n > 25 embryos per treatment). (F) Loss of GSNOR function alters the percentage of hepatocytes specified during liver formation. Tg(lfabp:GFP) morphants were dissociated and the percentage of GFP positive hepatocytes was analyzed by FACS. n = 4; ANOVA, p = 0.041, p = 0.002 in comparison to control. Results in (F) show mean ± SEM. EXPRESSION / LABELING:
PHENOTYPE:
|
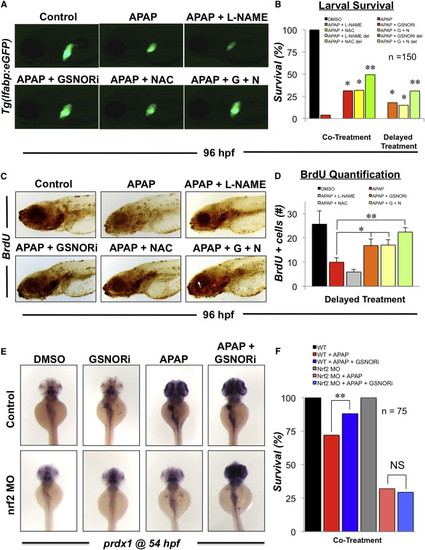
GSNOR Inhibition Is Hepatoprotective and Enhances Survival in Embryos Exposed to APAP via Activation of the Nrf2 Pathway (A) Effect of GSNORi and NAC on recovery from APAP-induced liver injury in Tg(lfabp:GFP) embryos. Tg(lfabp:GFP) embryos were exposed to a sublethal dose of APAP (5 mM) from 48 to 60 hpf at which point embryos were washed and subsequently exposed to GSNORi (1 μM) and/or NAC (10 μM) from 60 to 96 hpf. Representative fluorescent photomicrographs were taken at 10× magnification. (B) Survival in embryos exposed to a lethal dose of APAP (10 mM) from 48 to 96 hpf in the presence or absence of L-NAME (10 μM), GSNORi (1 μM), and NAC (10 μM). Under some conditions treatments were given after a 12 hr delay (del). n = 150; Fisher’s exact test, p < 0.001 compared to APAP alone, p < 0.001 compared to APAP + NAC. (C) Effect of GSNORi and NAC on proliferation following APAP-induced liver injury. Embryos were exposed to a sublethal dose of APAP (5 mM) from 48 to 60 hpf at which point embryos were washed and subsequently exposed to GSNORi (1 μM) and/or NAC (10 μM) from 60 to 96 hpf. Embryos were pulsed for 10 min in 10 mM BrdU just prior to fixation. Representative photomicrographs were taken at 10× magnification. (D) Quantification of BrdU positive cells in the regenerating liver of APAP exposed embryos exposed to GSNORi and/or NAC. n = 6; ANOVA, p < 0.05, p < 0.001 in comparison to APAP alone. (E) Effect of GSNORi (1 μM) and/or APAP (5 mM) exposure from 48 to 54 hpf on induction of the Nrf2 target gene, prdx1, as determined by in situ hybridization. Translation blocking ATG morpholino against nrf2 was injected at a concentration of 50 μM. (F) Survival in WT embryos and nrf2 morphants exposed to a lethal dose of APAP (10 mM) from 48 to 80 hpf in the presence or absence of GSNORi (1 μM). n = 75; Fisher’s exact test, p = 0.012. Results in (D) show mean ± SEM. EXPRESSION / LABELING:
PHENOTYPE:
|
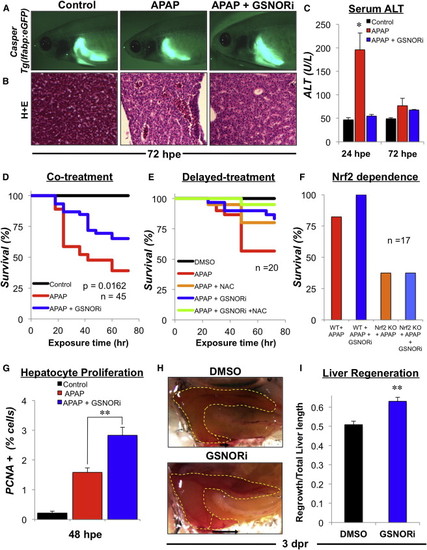
GSNOR Inhibition Protects Adult Zebrafish from APAP-Induced Toxicity and Enhances Regeneration following Liver Injury (A) In vivo fluorescent imaging of the liver in adult casper Tg(lfabp:GFP) fish exposed to 10 mM APAP for 18 hr before being exposed to GSNORi (1 μM). Adult fish were anaesthetized at 72 hpe and immediately imaged by fluorescent microscopy. Representative fluorescent photographs were taken at 10× magnification. (B) Hepatic histology (H&E) in fish exposed to APAP (10 mM) in the presence or absence of GSNORi (1 μM) at 48 hpe. (C) Serum alanine aminotransferase (ALT) activity in fish exposed to APAP (10 mM) in the presence or absence of GSNORi (1 μM) at 24 or 72 hpe. n = 6; ANOVA, p < 0.05 in comparison to control. (D) Kaplan-Meier plot of survival in adult fish exposed to APAP (10 mM) for 24 hr in the presence or absence of GSNORi (1 μM). Chemicals were removed 24 hpe, fish were reintroduced into fresh water and survival was monitored over 72 hr. n = 45; Kaplan-Meier estimate, p = 0.0162, Cox regression hazard ratio (HR) = 1.95. (E) Kaplan-Meier plot of survival in adult fish exposed to APAP (10 mM) for 18 hr followed by a delayed treatment with GSNORi (1 mM) and/or NAC (10 mM). n > 20 fish per treatment. (F) Survival in adult WT fish and Nrf2 mutant fish exposed to APAP (10 mM) in the presence or absence of GSNORi (1 μM) for 18 hr. n > 17 fish per treatment. (G) Hepatocyte proliferation was determined by immunohistochemical staining of PCNA positive hepatocytes in liver sections from WT fish exposed to APAP (10 mM) followed by delayed treatment with GSNORi (1 μM) at 48 hpe. n = 10; ANOVA, p < 0.001. (H) Liver regeneration following partial hepatectomy in adult zebrafish at 3 days post resection (dpr). Adult fish were exposed to DMSO or GSNORi (1 μM) 6 hr after surgery for 24 hr. Representative en bloc dissection photographs were taken at 2.5× magnification. (I) Quantification of liver regeneration as determined by the length of regrowth from the resection margin divided by the total length of the inferior lobe. n = 20; ANOVA, p < 0.001 in comparison to control. Results in (C), (G), and (I) show mean ± SEM. |
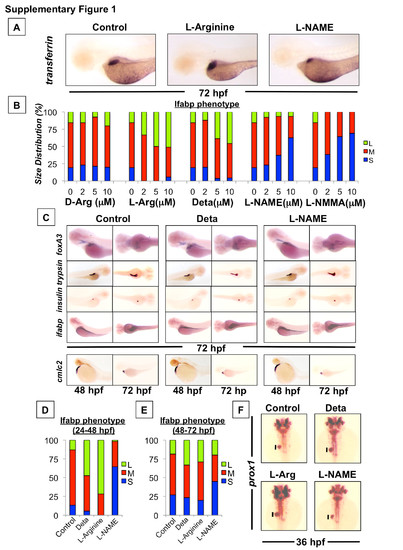
NO signaling regulates liver size during development in zebrafish. Effect of chemical modulators of NO signaling on liver formation as determined by in situ hybridization for the hepatocyte-specific gene transferrin. Representative photomicrographs were taken at 10x magnification. (B) Phenotypic analysis of liver size in embryos treated with different doses of alternate chemical modulators of NO signaling as determined by in situ hybridization for lfabp in treated embryos at 72 hpf (S=small, M=medium, L=large, N>50 embryos/treatment). (C) Effect of drug treatments on the development of other organ systems as determined by in situ hybridization for foxa3 (endoderm), trypsin (exocrine pancreas), insulin (endocrine pancreas), cmlc2 (heart) and ifabp (gut). Representative photomicrographs were taken at 10x magnification. (D and E) Phenotypic analysis of liver size in embryos treated with NO modulators from either 24-48 hpf or 48-72 hpf as determined by in situ hybridization for lfabp at 72 hpf (S=small, M=medium, L=large, N>50 embryos/treatment). (F) Effect of NO modulators (10 μM, 18-36 hpf) on hepatic progenitor cells as determined by in situ hybridization for prox1. Representative photomicrographs were taken at 10x magnification. |
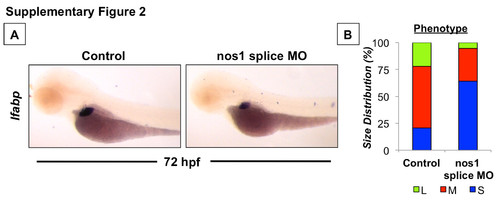
Constitutive NOS (nos1) activity is required for optimal liver development. (A) Effect of an alternate splice-site morpholino-mediated knockdown of nos1 on liver formation as assessed by in situ hybridization for lfabp at 72 hpf. Representative photomicrographs were taken at 10x magnification. (B) Phenotype analysis of liver size (lfabp) in nos1 morphants at 72 hpf (S=small, M=medium, L=large, N>50 embryos/treatment). |
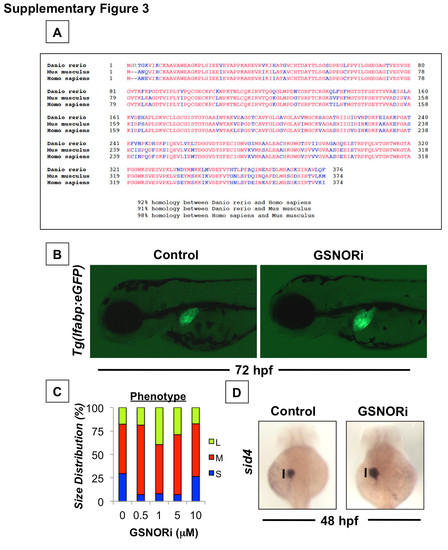
NO signaling regulates liver size in a cGMP-independent manner involving modulation of S-nitrosothiol homeostasis. (A) GSNOR (alcohol dehydrogenase 5, Type III) is highly conserved among vertebrates (Red = Conserved residues, Blue = Non-conserved residues). (B) Effect of GSNOR inhibition (1 μM) on liver size in Tg(lfabp:GFP) embryos. Representative fluorescent photomicrographs were taken at 10x magnification. (C) Phenotypic analysis of liver size in embryos treated with different doses of GSNORi as determined by in situ hybridization for lfabp in treated embryos at 72 hpf (S=small, M=medium, L=large, N>50 embryos/treatment). (D) Effect of GSNOR inhibition (1 μM) on hepatic progenitors as determined by in situ hybridization for sid4 at 48 hpf. |
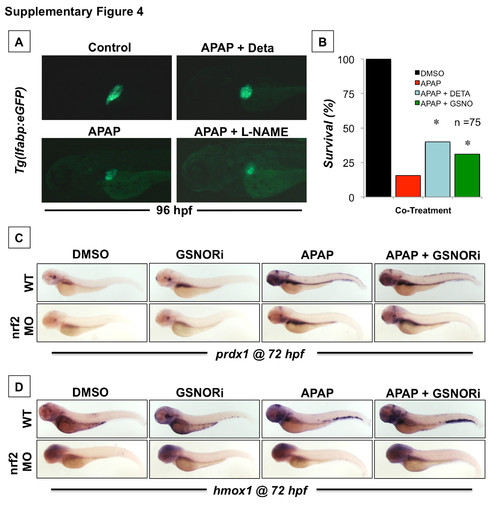
GSNOR inhibition is hepatoprotective and enhances survival in embryos exposed to APAP via activation of the Nrf2 pathway. (A) Effect of chemical modulators of NO signaling during APAP-induced liver injury in Tg(lfabp:GFP) embryos. Tg(lfabp:GFP) embryos were exposed to a sublethal dose of APAP (5 mM) from 48 to 96 hpf in the presence or absence of either Deta (10 μM) or L-NAME (10 μM). Representative fluorescent photomicrographs were taken at 10x magnification. (B) Survival in embryos exposed to a lethal dose of APAP (10 mM) from 48 to 96 hpf in the presence or absence of the alternate NO donors Deta (10 μM) or GSNO (5 μM). N=75; Fisher’s exact test, *p<0.001. (C and D) Effect of GSNORi (1 μM) and/or APAP (5 mM) exposure from 48-72 hpf on induction of the Nrf2 target genes, prdx1 and hmox1, as determined by in situ hybridization at 72 hpf. Translation blocking ATG morpholino against nrf2 was injected at a concentration of 50 μM. |
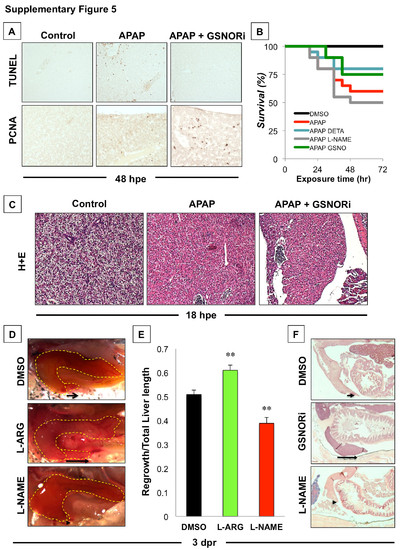
GSNOR inhibition protects adult zebrafish from APAP-induced toxicity and enhances regeneration following liver injury. (A) Immunohistochemistry analysis of cell death (TUNEL staining) and proliferation (PCNA staining) in fish exposed to APAP (10 mM) in the presence or absence of GSNORi (1 μM) at 48 hpe. (B) Kaplan-Meier plot of survival in adult fish exposed to APAP (10 mM) for 24 hr in the presence or absence of modulators of NO signaling, including Deta (5 μM), L-NAME (10 μM) and GSNO (5 μM). Chemicals were removed 24 hpe, fish were reintroduced into fresh water and survival was monitored over 72 hr. N = 20 fish / treatment. (C) Hepatic histology (H+E staining) in nrf2 mutant fish (nfe2l2afh318) exposed to APAP (10 mM) in the presence or absence of GSNORi (1 μM) at 18 hpe. (D) Liver regeneration following partial hepatectomy in adult zebrafish exposed to modulators of NO signaling at 3 days post resection (dpr). Adult fish were exposed to DMSO, L-Arg (10 μM) or L-NAME (10 μM) 6 hr after surgery for 24 hr. Representative en bloc dissection photographs were taken at 2.5x magnification. (D) Quantification of liver regeneration as determined by the length of regrowth from the resection margin divided by the total length of the inferior lobe. N=10; ANOVA, **p<0.01. (E) Histological evaluation of liver regeneration following partial hepatectomy at 3 dpr. Fish were sectioned and stained with hematoxylin and eosin (H+E). Representative sections were taken at 2.5x magnification. |