
FIGURE
Fig. 2
- ID
- ZDB-FIG-131231-32
- Publication
- Palha et al., 2013 - Real-time whole-body visualization of chikungunya virus infection and host interferon response in zebrafish
- Other Figures
- All Figure Page
- Back to All Figure Page
Fig. 2
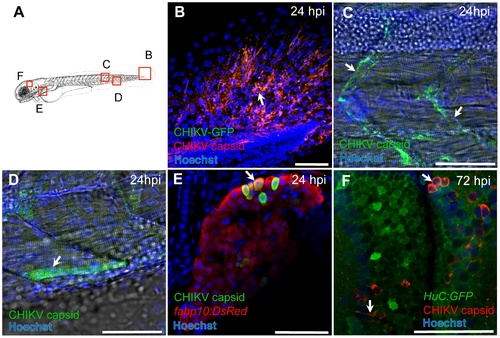
Cellular tropism of CHIKV. (A) Scheme of imaged regions in (B–F). (B–F) Confocal images of IHC-processed zebrafish at 24 hpi with CHIKV-GFP (B–E) or at 72 hpi with CHIKV-115 (F). As for all images, anterior to left, dorsal to top; scale bars, 50 μm. GFP staining in green in (B, F) DsRed staining in red in (E), capsid staining in red (B, F) or green (C–E); nuclei counterstained in blue. The fabp10:dsRed transgene labels hepatocytes, and HuC:GFP, post-mitotic neurons. Arrows show infection in fin fibroblasts (B), endothelial cells (C), a muscle fiber (D), hepatocytes (E) and neurons (F). |
Expression Data
| Genes: | |
|---|---|
| Fish: | |
| Condition: | |
| Anatomical Terms: | |
| Stage Range: | Day 4 to Day 6 |
Expression Detail
Antibody Labeling
Phenotype Data
Phenotype Detail
Acknowledgments
This image is the copyrighted work of the attributed author or publisher, and
ZFIN has permission only to display this image to its users.
Additional permissions should be obtained from the applicable author or publisher of the image.
Full text @ PLoS Pathog.