|
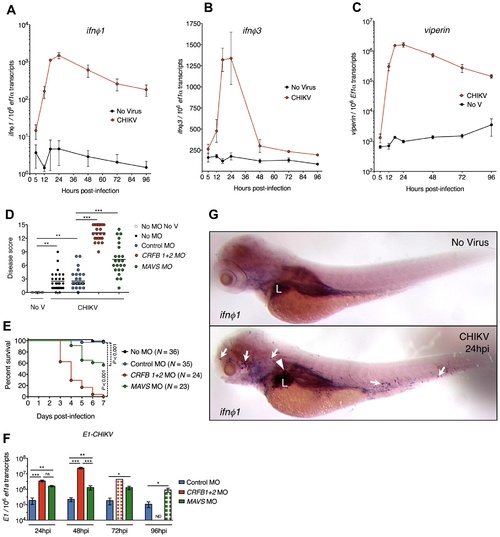
A protective interferon response is induced upon CHIKV infection. (A–C) Expression of zebrafish type I IFNs ifnφ1 (A) and ifnφ3 (B) and the IFN-stimulated gene viperin (C), upon CHIKV-GFP infection. qRT-PCR, mean ± s.e.m of 3 pools of 10 larvae from 3 independent experiments. (D–F) Effect of morpholino-mediated knockdown of IFN receptor subunits (CRFB1+2 MO) and of MAVS (MAVS MO) on CHIKV-GFP infection. No MO, not injected with a morpholino; No V, uninfected controls; Control MO, injected with a unspecific morpholino oligonucleotide. (D) Disease score at 3 days post-infection; (E) survival of infected zebrafish; (F) quantification of viral E1 transcripts over time. qRT-PCR, mean ± s.e.m of 3 pools of 3–5 larvae, except for the CRFB morphants at 72 hpi (one single pool of 5 larvae). Hatched bars represent groups where a fraction of the fish had already died, implying selection of survivors for the analysis. ND, not determined. (G) Pattern of ifnφ1 expression, whole-mount in situ hybridization in uninfected larva (top) or CHIKV-GFP infected larva (bottom) at 24 hpi, representative out of 7 fish. Arrows indicate some ifnφ1+ leukocytes, arrowhead point to an ifnφ1+ hepatocyte; L = liver. (***P < 0.001; **P < 0.01; *P < 0.05; ns - not significant).
|