
Fig. 1
- ID
- ZDB-FIG-131231-31
- Publication
- Palha et al., 2013 - Real-time whole-body visualization of chikungunya virus infection and host interferon response in zebrafish
- Other Figures
- All Figure Page
- Back to All Figure Page
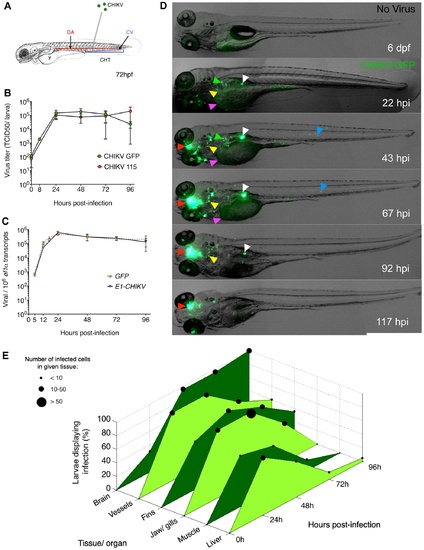
CHIKV replicates in zebrafish and disseminates to various organs. (A) Scheme of a 72 hours post-fertilization (hpf) larva, showing the site of injection in the dorsal aorta (DA) or caudal vein (CV), the caudal hematopoietic tissues (CHT) and the yolk syncitial cell (y). (B) Virus titers in zebrafish larvae infected with wild-type CHIKV-115 or with CHIKV-GFP. Data represent mean ± s.e.m of 2–5 pools of 4 larvae from 5 independent experiments. (C) qRT-PCR of viral E1 and GFP transcripts after CHIKV-GFP infection. Mean ± s.e.m of 3 pools of 10 larvae from 3 independent experiments. (D) Overlay of transmission and green fluorescence stereomicroscope images of a single representative wild-type CHIKV-GFP-infected larva, live imaged at different hours post infection (hpi). CHIKV infection is shown in the brain, liver, head mesenchyme, muscle, swim bladder and yolk (red, green, yellow, blue, white and magenta arrowheads, respectively). (E) Assessment using fluorescence stereomicroscopy of penetrance (% of infected larvae displaying infection) and severity (number of cells) of infection in specific organs at different time-points after CHIKV-GFP infection, following immunohistochemistry (IHC) with an anti-capsid antibody. Data pooled from 2 independent experiments, N = 20 larvae for each time-point. |