
Fig. 3
- ID
- ZDB-FIG-131231-33
- Publication
- Palha et al., 2013 - Real-time whole-body visualization of chikungunya virus infection and host interferon response in zebrafish
- Other Figures
- All Figure Page
- Back to All Figure Page
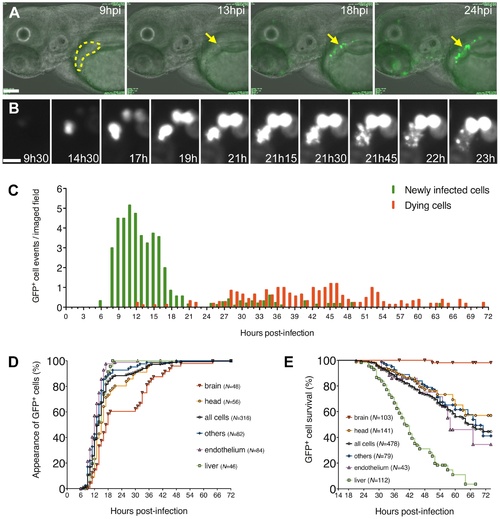
Kinetics of appearance and death of infected cells, from in vivo time-lapse imaging of CHIKV-GFP infection. (A, B) Movie frames showing emergence of infected cells (GFP+) in the liver and death of one cell during the first day of infection. Time post-infection (in hours and minutes) overlaid on images. (A) Entire field, overlay of transmission and GFP fluorescence (green), scale bar 100 µm. Liver delineated in yellow; arrows point to an hepatocyte becoming infected and dying. (B) Detail from the same movie, GFP fluorescence only, scale bar 20 μm, showing the rise and death of this infected hepatocyte. (C) Timings of appearance (green bars) and death (red bars) of immobile CHIKV-GFP infected cells, all organs pooled; (D, E) sub-analysis of the same dataset, showing kinetics of appearance (D) and death (E) of GFP+ cells per organ, displayed as Kaplan-Meier plots. N = Number of cells followed in each organ. In (C–E) data pooled from five independent experiments, with a total 24 fish imaged for 6–24 hours each, 4–8 animals per time-point. |