
Fig. 5
- ID
- ZDB-FIG-131231-35
- Publication
- Palha et al., 2013 - Real-time whole-body visualization of chikungunya virus infection and host interferon response in zebrafish
- Other Figures
- All Figure Page
- Back to All Figure Page
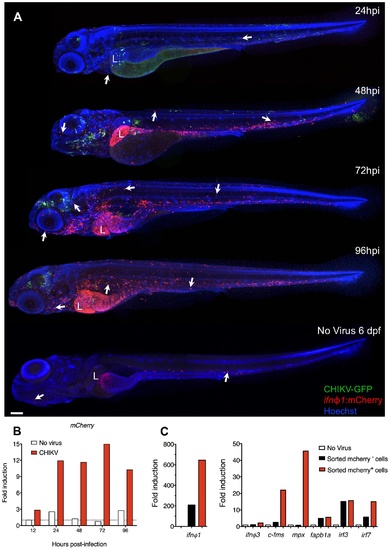
Ifnφ1-expressing cells are leukocytes and hepatocytes. (A) Distribution of ifnφ1-expressing cells revealed by the ifnφ1:mCherry reporter transgene. IHC, mCherry stained in red, GFP in green, nuclei in blue. Confocal imaging, reconstructed composite images of maximal projections to cover the whole body. Representative examples of CHIKV-GFP-infected fish at different time points after infection. Below is an uninfected control at the equivalent of 72 hpi. Arrows indicate some mCherry+ leukocytes, L = liver. Scale bar, 100 μm. (B) qRT-PCR of mCherry (normalized to ef1α) upon CHIKV-GFP infection in ifnφ1:mCherry fish. Fold induction to uninfected fish at 12 hpi; data for one pool of 10 larvae per time point. (C) Expression profile of FACS-sorted cells from CHIKV-infected ifnφ1:mCherry fish (3 dpi). qRT-PCR, fold induction compared to entire uninfected fish (No Virus). Data representative of 2 independent experiments. |
| Gene: | |
|---|---|
| Fish: | |
| Condition: | |
| Anatomical Terms: | |
| Stage Range: | Day 4 to Days 7-13 |