
Fig. 6
- ID
- ZDB-FIG-110516-61
- Publication
- Lauter et al., 2011 - Multicolor fluorescent in situ hybridization to define abutting and overlapping gene expression in the embryonic zebrafish brain
- Other Figures
- All Figure Page
- Back to All Figure Page
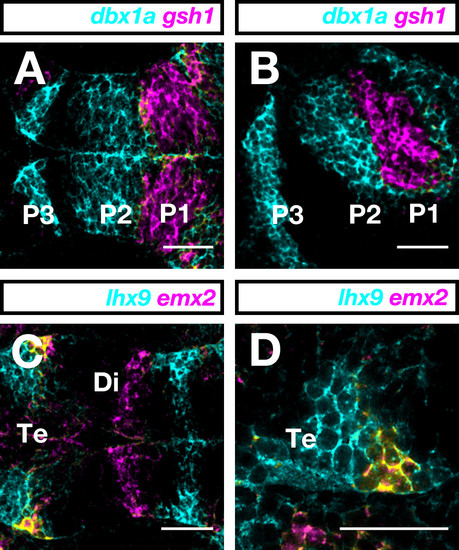
Two-color FISH. (A-D) Dorsal (A, C, D) and lateral (B) views of 1-dpf zebrafish forebrains with anterior to the left. (A, B) Digoxigenin-labeled dbx1a and dinitrophenyl-labeled gsh1 RNA probes are shown in cyan and magenta, respectively. (C, D) Digoxigenin-labeled emx2 and dinitrophenyl-labeled lhx9 RNA probes were visualized in magenta and cyan, respectively. In the telencephalon, emx2 and lhx9 are co-expressed in a lateral cell cluster (yellow). (D) Higher magnification of the area of colocalization (yellow) in the telencephalon. Photographs were taken on a LSM510 confocal microscope (Carl Zeiss). Images were false-colored with RGB look-up-tables and processed using ImageJ software. Scale bar = 50 μm. Di, diencephalon; P1, P2, and P3, prosomeres 1, 2, and 3; Te, telencephalon. |