
- Title
-
Multicolor fluorescent in situ hybridization to define abutting and overlapping gene expression in the embryonic zebrafish brain
- Authors
- Lauter, G., Söll, I., and Hauptmann, G.
- Source
- Full text @ Neural Dev.
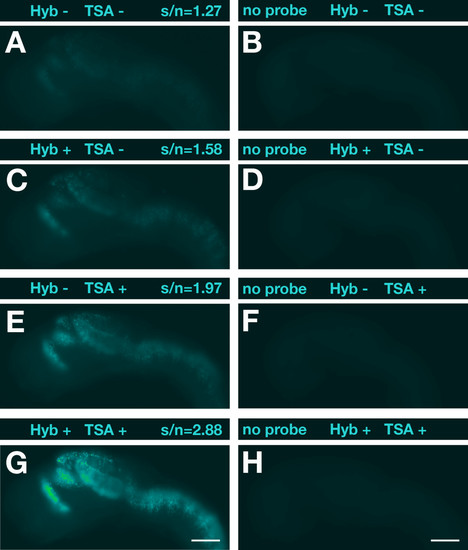
Optimization of hybridization and POD reaction by dextran sulfate. (A, C, E, G) Lateral views of 1-dpf zebrafish embryos hybridized with a digoxigenin-labeled antisense RNA probe specific for dbx1a are shown with anterior to the left. Above each panel signal-to-noise ratios (s/n) are indicated and whether dextran sulfate was added (+) or not (-) to the hybridization buffer (Hyb) and/or TSA reaction. (B, D, F, H) Embryos hybridized without probe were used as negative controls to assess background noise. Black-and-white pictures were recorded with identical exposure times using an Orca digital camera (Hamamatsu) on an Axioplan II microscope (Carl Zeiss). Images were false-colored with help of the ImageJ software and no further adjustments or other image processing was performed. Scale bar = 100 μm. |
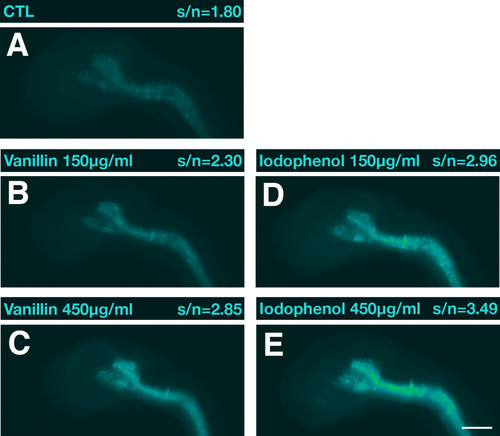
Positive effects of substituted phenol compounds on the TSA-POD reaction. Lateral views of 1-dpf zebrafish embryos hybridized with a digoxigenin-labeled antisense RNA probe specific for nkx6.1 are shown with anterior to the left. (A) Control (CTL); (B, C) vanillin added; (D, E) 4-iodophenol added. In all embryos shown, dextran sulfate was included in the hybridization and TSA-POD reaction. Above each panel signal-to-noise ratios (s/n) and compound concentrations are indicated. Black and white pictures were recorded with identical exposure times. Images were false-colored with help of the ImageJ software and no further adjustments or other image processing were performed. Scale bar = 100 μm. |
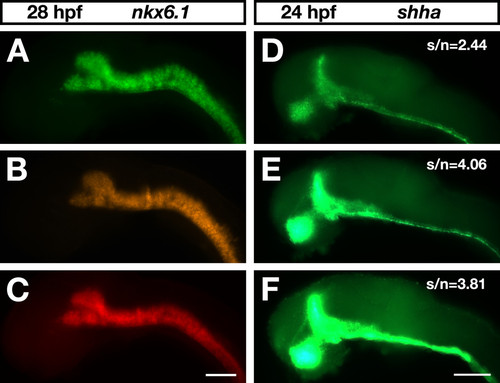
Bench-made fluorescent tyramides applied in zebrafish whole-mount FISH. Embryos were viewed on an Axioplan II microscope (Carl Zeiss). For excitation, a mercury burner (HBO 103 OSRAM) was used. Lateral views of zebrafish brains are shown with anterior to the left. Scale bar = 100 μm. (A-C) Zebrafish embryos at 28 hpf hybridized to a digoxigenin-labeled nkx6.1 antisense RNA probe. Images were captured with an Orca digital camera (Hamamatsu). As POD substrates, three different bench-made fluorogenic tyramides at a 1:250 dilution were used: (A) FAM-tyramide (exposure time, 100 ms; Chroma-filter 41001); (B) TAMRA-tyramide (exposure time, 4 ms; Chroma-filter 41002b); and (C) DyLight633-tyramide (exposure time, 120 ms; Chroma-filter 41008). (D-F) Zebrafish embryos at 24 hpf hybridized to a digoxigenin-labeled shha antisense RNA probe. Images were recorded with an Axiocam digital color camera (Carl Zeiss) using identical exposure times. Transcript distribution was visualized with (D) fluorescein-tyramide from Perkin Elmer (SAT701B001EA) at a 1:100 dilution, (E) bench-made FAM-tyramide at a 1:250 dilution, or (F) a 1:100 dilution. |
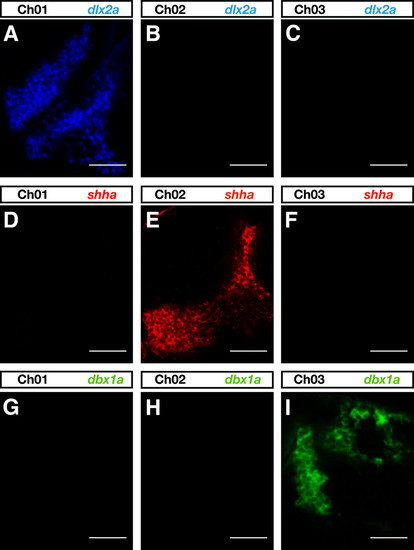
Test for bleed-through between channels using bench-made tyramides. (A-I) Single-color FISH experiments were performed with digoxigenin-labeled dlx2a (A-C), dinitrophenyl-labeled shha (D-F) and fluorescein-labeled dbx1a (G-I) RNA probes and visualized by FAM-, TAMRA- and DyLight633- tyramide, respectively. Lateral views of 1-dpf forebrains are shown with anterior to the left. Only the appropriate detection channel showed a bright signal and no significant bleed-through between channels was observed. Images were recorded with identical settings to those of Figure 7 on a LSM510 microscope (Carl Zeiss) and false colored in ImageJ. Scale bar = 50 μm. |
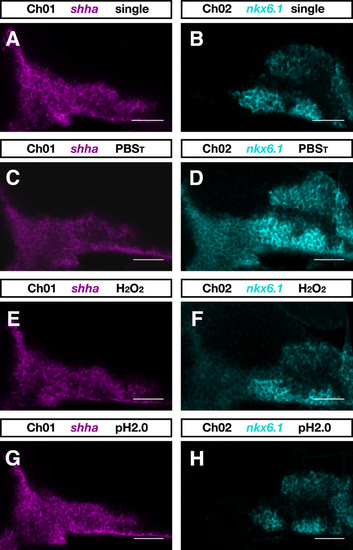
Inactivation of antibody-POD conjugate. Zebrafish embryos at 28 hpf were hybridized with dinitrophenyl-labeled shha and digoxigenin-labeled nkx6.1 RNA probes. (A, B) The expression patterns of shha (A) and nkx6.1 (B) as seen in single-color FISH experiments. In two-color experiments shha transcript was detected first using DyLight633-tyramide and nkx6.1 transcript was detected subsequently by FAM-tyramide. (C-H) Prior to the second round of detection, embryos were incubated for 10 minutes in PBST (PBS plus 0.1% Tween-20) (C, D), PBST containing 6% H2O2 (E, F), or 100 mM glycine-HCl pH 2.0 (G, H). Single confocal sections of zebrafish brains are shown in the DyLight633-detection channel (Ch01) and in the FAM-detection channel (Ch02) from a lateral view and with anterior to the left. Images were recorded on a LSM510 microscope (Carl Zeiss) and false colored in ImageJ. Scale bar = 50 μm. |
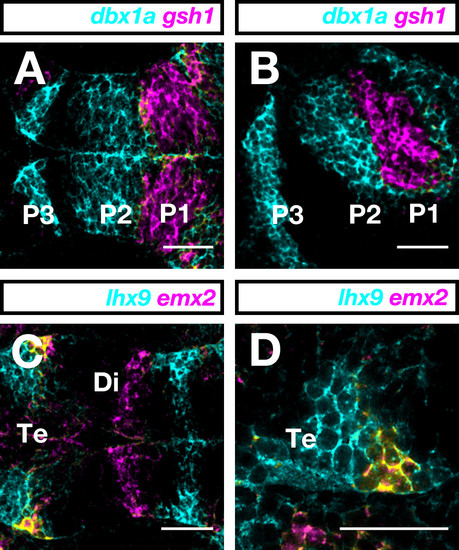
Two-color FISH. (A-D) Dorsal (A, C, D) and lateral (B) views of 1-dpf zebrafish forebrains with anterior to the left. (A, B) Digoxigenin-labeled dbx1a and dinitrophenyl-labeled gsh1 RNA probes are shown in cyan and magenta, respectively. (C, D) Digoxigenin-labeled emx2 and dinitrophenyl-labeled lhx9 RNA probes were visualized in magenta and cyan, respectively. In the telencephalon, emx2 and lhx9 are co-expressed in a lateral cell cluster (yellow). (D) Higher magnification of the area of colocalization (yellow) in the telencephalon. Photographs were taken on a LSM510 confocal microscope (Carl Zeiss). Images were false-colored with RGB look-up-tables and processed using ImageJ software. Scale bar = 50 μm. Di, diencephalon; P1, P2, and P3, prosomeres 1, 2, and 3; Te, telencephalon. |
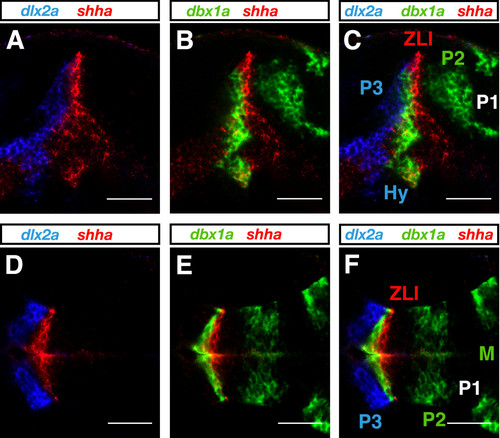
Three-color FISH. Embryos at 1 dpf were hybridized simultaneously with fluorescein-labeled dbx1a, dinitrophenyl-labeled shha and digoxigenin-labeled dlx2a RNA probes, sequentially detected and visualized using DyLight633-, TAMRA- and FAM-tyramide, respectively. (A-F) In lateral (A-C) and dorsal (D-F) views with anterior to the left, dbx1a, shha and dlx2a expression is shown in green, red and blue, respectively. Overlays of two (A, B, D, E) or all three (C, F) different channels of the same confocal plane are shown. Photographs were taken on a LSM510 confocal microscope (Carl Zeiss). Images were false-colored with RGB look-up tables and processed using ImageJ software. Scale bar = 50 μm. Hy, hypothalamus; M, midbrain; P1, P2, and P3, prosomeres 1, 2, and 3; ZLI, zona limitans intrathalamica. |