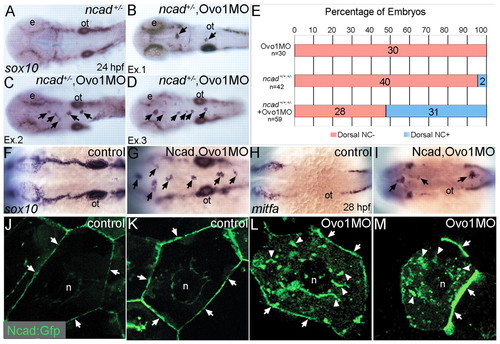
Interactions between Ovo1 and Ncad. (A-I) Ovo1 genetically interacts with Ncad. (A-G) In situ hybridization for sox10 expression. In both wild types and heterozygous ncad+/- mutants (A), sox10 expression marks bilateral stripes of migrating NC at 24 hpf. Dorsal views, anterior to the left. (B-D) In ncad+/- heterozygotes injected with subthreshold levels of Ovo1 MO, a subset of sox10-positive NC cells remains at the dorsal midline [arrows; examples (Ex) 1-3]. (E) Quantitation of wild-type (red bars) and ectopic dorsal (blue bars) sox10+ NC cells. In contrast to controls (F), ectopic sox10+ cells (G) cluster in the dorsal midline in embryos injected with subthreshold levels of both Ovo1 and Ncad MOs. (H,I) In situ hybridization for mitfa expression. In contrast to controls (H), ectopic cells at the dorsal midline express mitfa (I, arrows). (J-M) Ovo1 regulates Ncad localization. Confocal images of EVL cells in embryos injected with Ncad:Gfp. Ncad:Gfp localizes to the membrane (arrows) and perinuclear region (n, nucleus) of control cells (J,K), whereas Ncad:Gfp accumulates in the cytoplasm of Ovo1 morphant cells (L,M arrowheads). e, eye; n, nucleus; ot, otic vesicle.
|
