
Fig. 2
- ID
- ZDB-FIG-090127-2
- Publication
- Batista et al., 2008 - Zebrafish V2 cells develop into excitatory CiD and Notch signalling dependent inhibitory VeLD interneurons
- Other Figures
- All Figure Page
- Back to All Figure Page
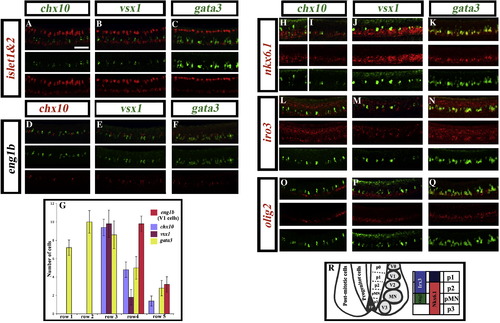
Expression of transcription factors in the V2 domain. Lateral views of double in situ hybridisation in wild-type trunks at 24 h. islet1 and islet2 (probes mixed) are shown in red (A–C); eng1b is shown in green (D) and red (E and F); chx10 is shown in green (A, H, I, L and O) and red (D); vsx1 is shown in green (B, E, J, M and P); gata3 is shown in green (C, F, K, N and Q); nkx6.1, iro3 and olig2 are all shown in red (H–Q). Panel H shows expression in the anterior of the embryo and panel I shows expression in the posterior of the embryo. Scale bar = 50 μm. (G) Graph showing the number of cells in rows 1–5 at 24 h expressing V2 markers gata3, chx10 or vsx1 or V1 marker eng1b. None of these genes are expressed dorsal to row 5 at this stage. All cell counts are from a 5 somite length of spinal cord adjacent to somites 6–10. Values shown are the mean from 5 different embryos. Error bars indicate standard deviations. (R) Schematic showing the dorsal–ventral location of different ventral post-mitotic interneuron domains (V0–V3), the motoneuron domain (MN) and transcription factors that demarcate the p2 progenitor domain. |
| Genes: | |
|---|---|
| Fish: | |
| Anatomical Term: | |
| Stage: | Prim-5 |
Reprinted from Developmental Biology, 322(2), Batista, M.F., Jacobstein, J., and Lewis, K.E., Zebrafish V2 cells develop into excitatory CiD and Notch signalling dependent inhibitory VeLD interneurons, 263-275, Copyright (2008) with permission from Elsevier. Full text @ Dev. Biol.