
Fig. 5
- ID
- ZDB-FIG-090127-5
- Publication
- Batista et al., 2008 - Zebrafish V2 cells develop into excitatory CiD and Notch signalling dependent inhibitory VeLD interneurons
- Other Figures
- All Figure Page
- Back to All Figure Page
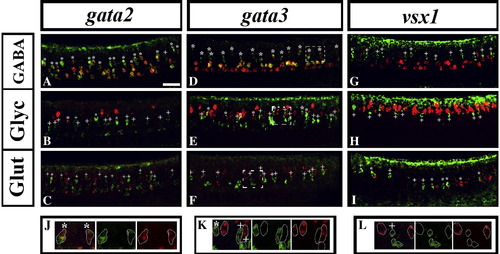
V2b cells are inhibitory and V2a cells are excitatory. Lateral views of the spinal cord in wild-type trunks at 24 h. Double in situ hybridisation merged images showing GABAergic markers (A, D and G), glycinergic markers (B, E and H) and glutamatergic markers (C, F, and I) in red, and gata2 (A–C), gata3 (D–F) and vsx1 (G–I) in green. Anterior is left, dorsal is up. Scale bar = 50 μm. Panel J shows a single focal plane magnified image of the dashed white box in panel D. Panel K shows a single focal plane magnified image of the dashed white box in panel E. Panel L shows a single focal plane magnified image of the dashed white box in panel F. In these higher magnification views, merged images are on the left, followed by the single green channel and then the single red channel. In all merged images, double-labelled cells in the V2 domain are indicated with stars. V2 cells not expressing a particular neurotransmitter (single-labelled green cells) are indicated with crosses. For quantification of these results see Fig. 6. |
| Genes: | |
|---|---|
| Fish: | |
| Anatomical Terms: | |
| Stage: | Prim-5 |
Reprinted from Developmental Biology, 322(2), Batista, M.F., Jacobstein, J., and Lewis, K.E., Zebrafish V2 cells develop into excitatory CiD and Notch signalling dependent inhibitory VeLD interneurons, 263-275, Copyright (2008) with permission from Elsevier. Full text @ Dev. Biol.