|
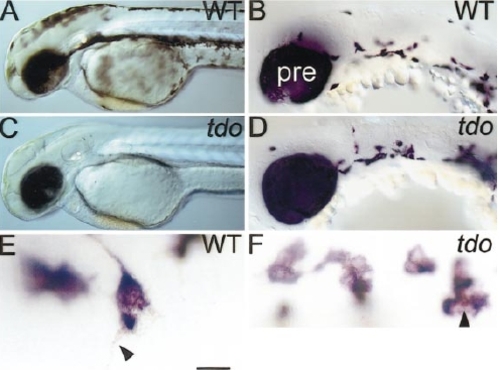
tdo mutants have disrupted melanophore differentiation, but have the wild-type number of melanoblasts. Lateral views of 2-dpf wild-type (A) and tdo- (C) embryos show highly reduced melanin in latter. In contrast, dct in situ hybridisation reveals a normal number and distribution of melanoblasts at 27 hpf (D, compare to wild-type in B). Note also the normal levels of dct expression in the PRE. (E and F) High-magnification view of labelled melanophores in hybridised 27-hpf embryos reveals dct-positive melanoblasts in tdo- (F). In wild-type melanophores melanin granules are dispersed in cell extensions (arrowhead, E), whilst tdo- melanophores show melanin clustered in the centre of the cell body (arrowhead, F). Thus, in wild types, melanin is more widely dispersed in the cell than dct transcripts (E), whilst in tdo- embryos it is less widely dispersed (F). Scale bar: 210 μm (A, C), 50 μm (B, D), 20 μm (E, F).
|