
Fig. 6
- ID
- ZDB-FIG-070821-3
- Publication
- Kelsh et al., 2000 - Genetic analysis of melanophore development in zebrafish embryos
- Other Figures
- All Figure Page
- Back to All Figure Page
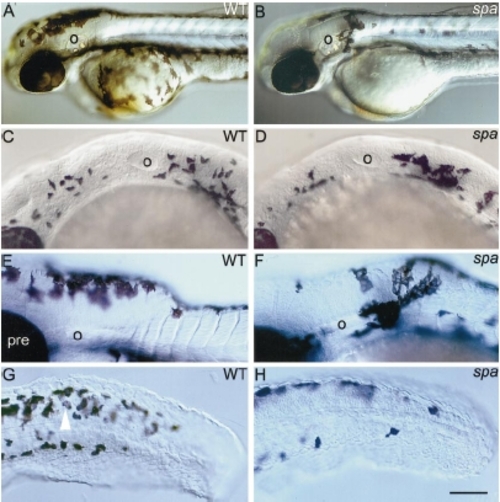
spa- embryos show reduced numbers and migration of melanoblasts. Lateral views of 2-dpf wild-type (A) and spa- (B) embryos to show reduced numbers of ventral melanophores and an ectopic cluster behind otic vesicle (o). Wild types (C, E) and spa- siblings (D, F) show large numbers of dct-positive cells in the posterior head at 25 hpf (C, D), but reduced numbers in spa- embryos at 36 hpf (F; compare E). These melanoblasts remain more densely clustered, particularly just posterior to the otic vesicle (E, F). (G, H) Melanin and dct mark melanophores, whilst dct alone marks melanoblasts (white arrowhead) in the tail of wild types (G) and spa- siblings (H) at 36 hpf. Note the paucity of ventral melanophores in mutant embryos. Scale bar: 200 μm (A, B), 75 μm (C, D), 100 μm (E, F), 75 μm (G, H). |
| Fish: | |
|---|---|
| Observed In: | |
| Stage Range: | Prim-5 to Long-pec |
Reprinted from Developmental Biology, 225(2), Kelsh, R.N., Schmid, B., and Eisen, J.S., Genetic analysis of melanophore development in zebrafish embryos, 277-293, Copyright (2000) with permission from Elsevier. Full text @ Dev. Biol.