
Fig. 4
- ID
- ZDB-FIG-070821-1
- Publication
- Kelsh et al., 2000 - Genetic analysis of melanophore development in zebrafish embryos
- Other Figures
- All Figure Page
- Back to All Figure Page
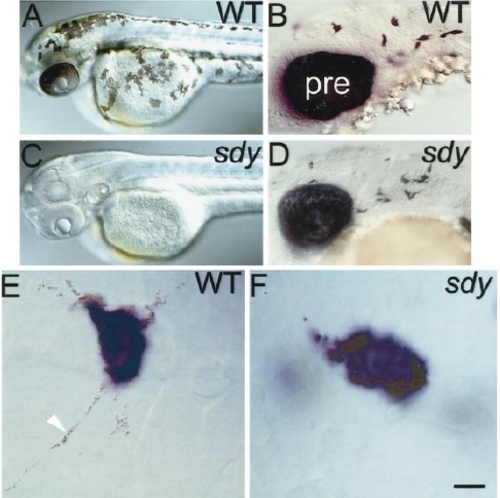
sdy- embryos lack melanin but have the wild-type number of melanoblasts. Dorsolateral views of head and anterior trunk in 2-dpf wild-type (A) and sdy- (C) embryos to show lack of melanin. In contrast, dct in situ hybridisation reveals a normal number and distribution of melanoblasts at 27 hpf (D, compare to wild type in B). Note also the normal levels of dct expression in the PRE. (E and F) High-magnification view of labelled melanophores in hybridised 27-hpf embryos reveals dct-positive melanoblasts in sdy- embryos (F), which lack the melanin so prominent in wild-type melanophores (arrowhead, E). alb- embryos show same phenotype (data not shown). pre, PRE. Scale bar: 200 μm (A, C), 50 μm (B, D), 10 μm (E, F). |
| Gene: | |
|---|---|
| Fish: | |
| Anatomical Terms: | |
| Stage: | Prim-5 |
| Fish: | |
|---|---|
| Observed In: | |
| Stage Range: | Prim-5 to Long-pec |
Reprinted from Developmental Biology, 225(2), Kelsh, R.N., Schmid, B., and Eisen, J.S., Genetic analysis of melanophore development in zebrafish embryos, 277-293, Copyright (2000) with permission from Elsevier. Full text @ Dev. Biol.