
Fig. 3
- ID
- ZDB-FIG-060912-3
- Publication
- Kelsh et al., 2000 - Genetic analysis of melanophore development in zebrafish embryos
- Other Figures
- All Figure Page
- Back to All Figure Page
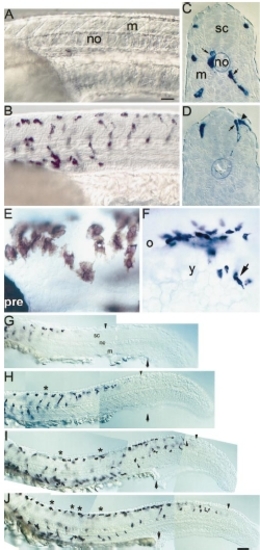
dct is a marker for melanoblasts both during and after migration. (A) Lateral view of 25-hpf wild-type embryo shows no melanin in the posterior trunk. (B) In contrast, dct in situ RNA hybridisation at the same stage reveals many strongly labelled cells (purple). (C and D) Transverse sections through trunk of labelled embryos reveals that these cells are found on both the medial (arrows) and the lateral (arrowhead) neural crest migration pathways. (E) Lateral view of dorsal head of 48-hpf wild-type embryo labelled with dct shows purple in situ hybridisation product in all melanophores (brown colour is melanin). (F) Dorsolateral view of posterior head at 24 hpf to show melanoblasts (arrow) migrating on dorsal yolk sac (y). A cluster of dct-positive melanoblasts sits posterior to the otic vesicle (o). (G–J) Time course of dct expression pattern revealed by in situ RNA hybridisation; lateral views of trunk and tail. (G) 21, (H) 24, (I) 27, and (J) 30 hpf. Embryos are actively elongating at these stages, as seen here in the tail; all embryos are aligned by position of anus (distal end of yolk sac extension; arrow). Posterior shift in posteriormost boundary of dct-expressing cells is indicated by arrowheads. Note how posteriormost dct expression is always in cells located dorsal or dorsolateral to the spinal cord, but that more anterior cells are found more ventrally, including many in or near the ventral stripe located above the yolk sac (I, J). Many cells show an elongated, migratory morphology. In contrast, postmigratory cells show a flattened, more symmetrical morphology, e.g., dorsal stripe melanoblasts are seen as flattened cells (asterisks) on the dorsal aspect of the spinal cord (sc). Their number increases with age, from zero at 21 hpf (A) to many at 30 hpf (D). Subsequently, the number increases further. Dorsal uppermost, anterior to left in this and other figures unless stated otherwise. C and D are transverse sections, dorsal uppermost. m, muscle; no, notochord; pre, PRE; sc, spinal cord. Scale bar: 25 μm (A, B), 20 μm (C, D, F), 50 μm (E, G–J). |
| Gene: | |
|---|---|
| Fish: | |
| Anatomical Terms: | |
| Stage Range: | 20-25 somites to Long-pec |
Reprinted from Developmental Biology, 225(2), Kelsh, R.N., Schmid, B., and Eisen, J.S., Genetic analysis of melanophore development in zebrafish embryos, 277-293, Copyright (2000) with permission from Elsevier. Full text @ Dev. Biol.