
Fig. 7
- ID
- ZDB-FIG-070314-2
- Publication
- Kelsh et al., 2000 - Genetic analysis of melanophore development in zebrafish embryos
- Other Figures
- All Figure Page
- Back to All Figure Page
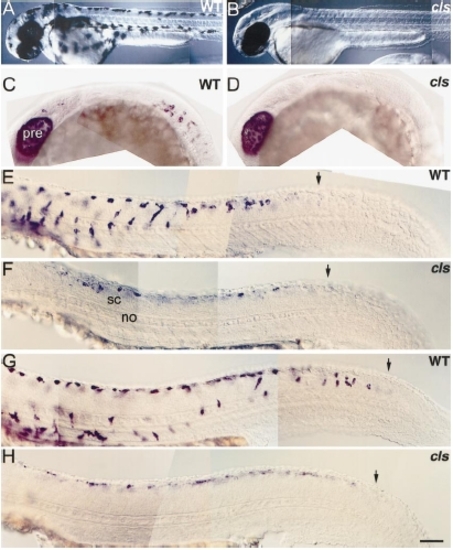
cls- embryos have very reduced melanoblast numbers. Lateral views of 2-dpf wild-type (A) and cls- (B) larvae to show severe melanophore defect. (C–H) Wild-type and cls- embryos processed for dct in situ hybridisation. (C, D) Lateral views of head and trunk at 21 hpf reveal earliest detected cls- phenotype; melanoblasts are absent from mutants at this stage. Note that the PRE expresses dct at the normal high levels. Lateral views of trunk and tail at 24 (E, F) and 30 hpf (G, H) show reduced melanoblast number in mutants. These cells are expressing dct at lower levels (all embryos were processed simultaneously and the staining reactions developed for the same amount of time) and none of them have migrated away from the neural tube. Note, however, that the timing of dct expression is normal: the posterior boundary of dct-positive cells is similar in wild types and mutants (arrows). Abbreviations as Fig. 2. Scale bar: 200 μm (A, B), 100 μm (C, D), 50 μm (E–H). |
| Fish: | |
|---|---|
| Observed In: | |
| Stage Range: | 20-25 somites to Long-pec |
Reprinted from Developmental Biology, 225(2), Kelsh, R.N., Schmid, B., and Eisen, J.S., Genetic analysis of melanophore development in zebrafish embryos, 277-293, Copyright (2000) with permission from Elsevier. Full text @ Dev. Biol.