
Fig. 2
- ID
- ZDB-FIG-060824-2
- Publication
- Gulati-Leekha et al., 2006 - A reporter-assisted mutagenesis screen using α1-tubulin-GFP transgenic zebrafish uncovers missteps during neuronal development and axonogenesis
- Other Figures
- All Figure Page
- Back to All Figure Page
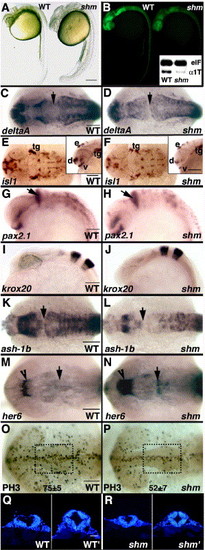
sookshma, a low GFP mutant displays fewer neural precursors caused by a cell proliferation deficit whereas neural patterning remains unperturbed. Bright-field (A) and fluorescent (B) images of live, 28 hpf wild-type (WT) and sookshma (shm) embryos. Inset in panel B shows the corresponding RT-PCR profile at 32 hpf for endogenous α1-tubulin (α1T) and e-1F4α (e1F) control transcripts. Expression analysis of neurogenesis and neural patterning markers at 28 hpf by ISH (C–J). deltaA expression shows that the neuronal (progenitor + postmitotic cell) population in mutants is severely compromised (C and D), islet-1-positive postmitotic neuronal clusters are slightly reduced in the HB (E and F) with more perceptible decrease in FB (insets, E and F) whereas MB-HB boundary (pax2.1; G and H) and rhombomeric segments (krox-20; I and J) are completely unaffected. Decrease in neural precursors, evident at 22 hpf by weaker ash-1b expression (K and L), is not completely attributable to her6 de-repression, which is significantly expanded only in the FB-anterior MB domain (arrowhead; M and N) accompanied by a modest increase at the MB-HB boundary (arrow; M and N). Instead, shm embryos harbor fewer PH3-positive mitotic figures at 19.5 hpf causing a reduction in α1-tubulin/GFP-expressing neural precursors (O and P). Mitotic cells in the outlined area were counted (75.3 ± 5.1 in WT, n = 4; 52.4 ± 6.6 in shm, n = 4). Proliferation defect leads to a thinner mutant neural tube with fewer cells (Q and R). Images show DAPI-stained transverse sections at the widest part of the HB (WT, shm) and MB ventricles (WT', shm') in both wild-type and mutant neural tubes. Total cell counts at MB level: 329.2 ± 17.2 cells/section (WT, n = 2) and 244.7 ± 29.1 cells/section (shm, n = 3). Panels A and B, insets in E and F, and G–J are all lateral views; panels C–F, K–P are dorsal views. Anterior is towards left in all whole-embryo images. Arrows present a reference point by marking the MB-HB boundary. Scale bars: 250 μm in panels A and B, 50 μm in panels Q and R, 100 μm in all other images. tg, trigeminal ganglia; v, ventrorostral cluster; d, dorsorostral cluster; e, epiphyseal cluster. |
| Genes: | |
|---|---|
| Fish: | |
| Anatomical Terms: | |
| Stage Range: | 26+ somites to Prim-15 |
Reprinted from Developmental Biology, 296(1), Gulati-Leekha, A., and Goldman, D., A reporter-assisted mutagenesis screen using α1-tubulin-GFP transgenic zebrafish uncovers missteps during neuronal development and axonogenesis, 29-47, Copyright (2006) with permission from Elsevier. Full text @ Dev. Biol.