
- Title
-
A wave of free cytosolic calcium traverses zebrafish eggs on activation
- Authors
- Lee, K.W., Webb, S.E., and Miller, A.L.
- Source
- Full text @ Dev. Biol.
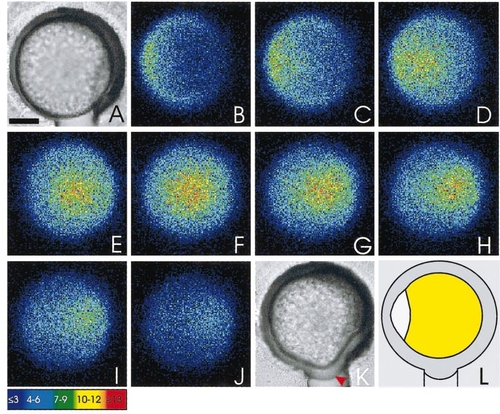
Representative sequence of images from an aequorin-loaded egg illustrating changes in intracellular free calcium during activation in the absence of sperm. A is a bright-field image of the unactivated egg just prior to the initiation of the signal and shows no separation between the chorion and the egg plasma membrane, whereas K shows the egg after the passage of the calcium wave, clearly indicating (arrowhead) a raised chorion. Each photon image (B to J) represents 60 s of accumulated light, with a 20-s step separating each successive image. The schematic image (L) shows subsequent blastodisc (in white) formation and thus the location of the animal pole during wave propagation. The egg developed only as far as a few abortive cleavages. Color scale indicates luminescent flux in photons per pixel. Scale bar is 200 μm. |
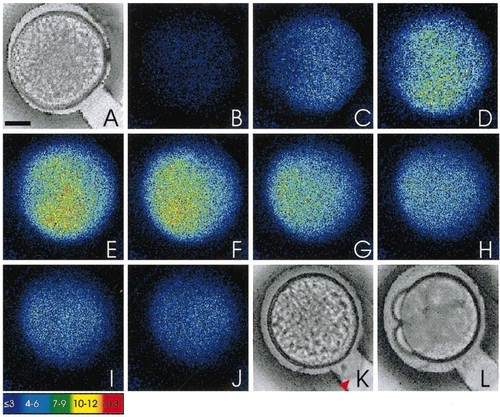
Representative sequence of images from an aequorin-loaded egg illustrating changes in intracellular free calcium during activation in the presence of sperm. A is a bright-field image of the unactivated egg just prior to the initiation of the signal and once again shows no separation between the chorion and the egg plasma membrane, whereas K shows the egg after the passage of the calcium wave, clearly indicating (see arrowhead) a raised chorion. L shows the egg at the 4-cell stage, indicating that it has been fertilized and is developing normally. The photon images (B to J) represent 60 s of accumulated light, with a 20-s step separating each successive image. The dividing blastodisc in L indicates the location of the AP. Color scale indicates luminescent flux in photons per pixel. Scale bar is 200 μm. |
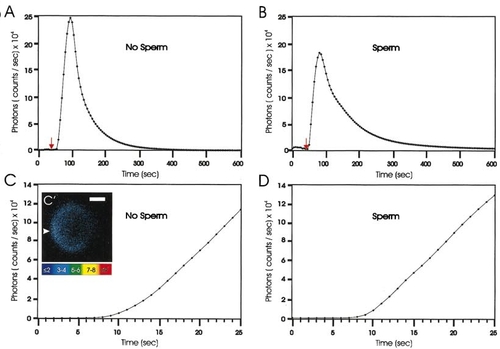
Representative profiles of luminescence from aequorin-loaded eggs activated either in the absence (A and C) or in the presence (B and D) of sperm. These data were gathered using our PMT system. A and B illustrate plots (every 5 s) of the total luminescent output for the entire activation process. C and D show luminescent output at a higher temporal resolution (every 1 s), indicating an initial period (around 3–5 s) of lower level emission prior to the explosive rise. Red arrows in A and B indicate the addition to the egg-injection chamber of either 0.5% fructose in egg-water (A) or 0.5% fructose in egg-water 30 s after the addition of concentrated sperm suspension (B). C′ illustrates the first 10 s of the activation response of the egg shown in Fig. 3, indicating the initial low-intensity localized response around the micropyle (arrowhead) in the animal hemisphere. Color scale indicates luminescent flux in photons per pixel. Scale bar is 200 μm. |
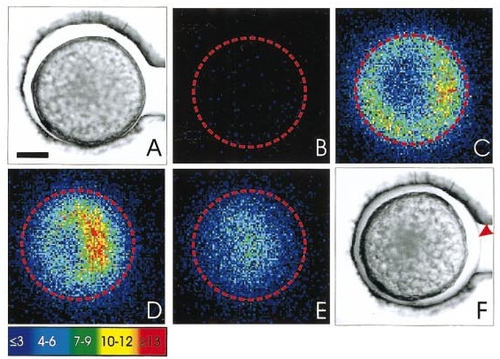
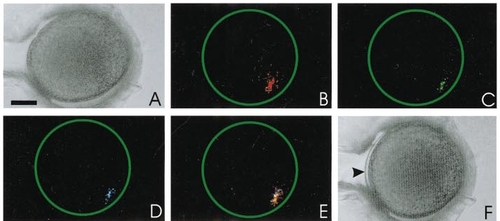
Representative series of images of a vegetal pole (VP) view of an activation wave indicating that the wave propagates mainly in the periphery of the egg. A and F are bright-field images of the egg before and after activation, respectively. The arrowhead in F indicates the raised chorion. B illustrates the resting level of luminescence prior to activation. C indicates the activation wave at the equator of the egg, and D and E demonstrate the subsequent progression of the wave to the VP. The location of the egg equator is outlined. B to E show 60 s of accumulated light. Color scale indicates luminescent flux in photons per pixel. Scale bar is 200 μm. |
A representative example of a zebrafish egg with fluorescent microspheres loaded into its periphery. A and F are bright-field images taken before and after activation, respectively. A shows no separation between the chorion and the egg plasma membrane, whereas in F, the chorion is clearly raised (see arrowhead). B to D indicate confocal images taken at an optical plane containing the fluorescent microspheres. The fluorescent image in B was taken before the addition of 0.5% fructose in egg-water and then C and D at 2.5 and 5 min later, respectively. E shows the fluorescent images from B, C, and D superimposed on one another. This demonstrates that the egg does not rotate within its expanding chorion during the activation process. Scale bar is 200 μm. |
Reprinted from Developmental Biology, 214(1), Lee, K.W., Webb, S.E., and Miller, A.L., A wave of free cytosolic calcium traverses zebrafish eggs on activation, 168-180, Copyright (1999) with permission from Elsevier. Full text @ Dev. Biol.