
Fig. 6
- ID
- ZDB-FIG-080925-28
- Publication
- Lee et al., 1999 - A wave of free cytosolic calcium traverses zebrafish eggs on activation
- Other Figures
- All Figure Page
- Back to All Figure Page
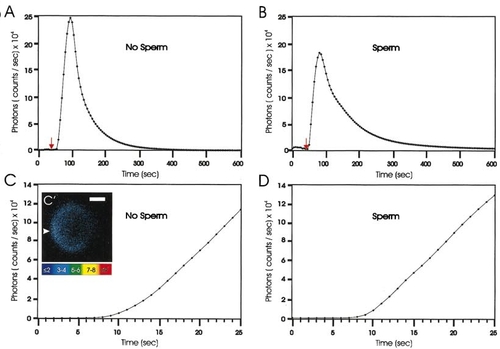
Representative profiles of luminescence from aequorin-loaded eggs activated either in the absence (A and C) or in the presence (B and D) of sperm. These data were gathered using our PMT system. A and B illustrate plots (every 5 s) of the total luminescent output for the entire activation process. C and D show luminescent output at a higher temporal resolution (every 1 s), indicating an initial period (around 3–5 s) of lower level emission prior to the explosive rise. Red arrows in A and B indicate the addition to the egg-injection chamber of either 0.5% fructose in egg-water (A) or 0.5% fructose in egg-water 30 s after the addition of concentrated sperm suspension (B). C′ illustrates the first 10 s of the activation response of the egg shown in Fig. 3, indicating the initial low-intensity localized response around the micropyle (arrowhead) in the animal hemisphere. Color scale indicates luminescent flux in photons per pixel. Scale bar is 200 μm. |
Reprinted from Developmental Biology, 214(1), Lee, K.W., Webb, S.E., and Miller, A.L., A wave of free cytosolic calcium traverses zebrafish eggs on activation, 168-180, Copyright (1999) with permission from Elsevier. Full text @ Dev. Biol.