
- Title
-
TMEM63A, associated with hypomyelinating leukodystrophies, is an evolutionarily conserved regulator of myelination
- Authors
- Halford, J., Senatore, A.J., Berryman, S., Muñoz, A., Semidey, D., Doan, R.A., Coombs, A.M., Noimany, B., Emberley, K., Emery, B., Monk, K.R., Murthy, S.E.
- Source
- Full text @ Proc. Natl. Acad. Sci. USA

HLD19-associated TMEM63A mutations are LOF. (A) Topology map of TMEM63A indicating LOF mutation sites. (B) Representative traces of stretch-activated currents induced by negative pipette pressure from HEK-P1KO cells transfected with WT TMEM63A or the indicated mutant. Pressure stimulus trace is illustrated above. (C) Maximal stretch-activated currents (Imax) recorded from WT and variants (n = 18 for WT, n = 10 for mutant constructs, across multiple transfections, One-way ANOVA, Kruskal–Wallis test of multiple comparisons). |
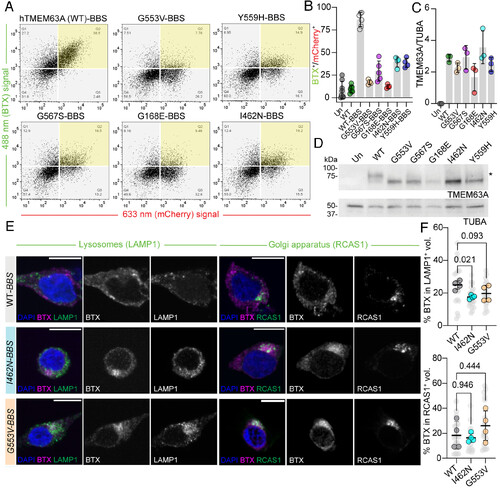
HLD19-associated TMEM63A LOF mutations prevent plasma membrane localization. (A) Representative flow cytometry data plots for cells transfected with WT TMEM63A or indicated mutant, with BBS. Transfected cells identified by mCherry fluorescence (633 nm signal). Surface TMEM63A binding identified by BTX-AF488 fluorescence (488 nm signal). Region of overlap between BTX-labeled and transfected cells highlighted in yellow. (B) Percentage of gating events overlapping between BTX-labeled and transfected cells for WT (with and without BBS) and indicated mutants (with BBS) (n = 4 to 8 transfections per construct, P-values for all comparisons between WT-BBS and mutant-BBS is <0.0001, One-way ANOVA, Kruskal–Wallis test of multiple comparisons). (C) Quantification of TMEM63A immunoblot signal density, normalized to tubulin alpha chain (TUBA) signal density (n = 3 transfections per construct, P-value for all comparisons between WT and mutant is >0.05, One-way ANOVA, Dunnett’s multiple comparisons against WT). (D) Representative immunoblots of lysates prepared from cells transfected with WT TMEM63A or indicated mutant, probed against TMEM63A or TUBA (loading control). * indicates glycosylated band. (E) Representative micrographs of BTX-labeled HEK-P1KO cells transfected with BBS-tagged TMEM63A (WT and selected HLD19-associated variants) costained for LAMP1 (Left) or RCAS1 (Right). BTX (magenta), organelle marker (green), and DAPI (blue) are shown in merged images; BTX and organelle channels are shown separately (grays). (Scale bar, 10 µm.) (F) Percentage total BTX signal density residing in organelle-stained volume for lysosomes (LAMP1+, Top) and Golgi apparatus (RCAS1+, Bottom). Individual cells in light gray, culture/transfection averages in color. One-way ANOVA, Dunnett’s multiple comparisons against WT values (n = 4 transfections per construct/organelle stain). |
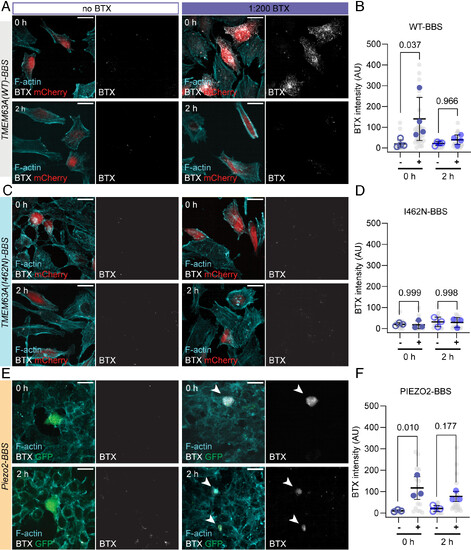
TMEM63A is transiently localized to the plasma membrane. (A) Representative micrographs of HeLa-P1KO cells transfected with TMEM63A(WT)-BBS/IRES/mCherry prior to incubation with BTX-AF 647. Cells were fixed either immediately after (0 h) or 2 h after removal of BTX conjugate (2 h). BTX signal (grays), F-actin (cyan), and mCherry (red) are shown. (Scale bar, 20 µm.) (B) Quantification of BTX signal at 0 h and 2 h post labeling for conditions with (solid markers) or without (empty markers) conjugate for TMEM63A(WT)-BBS. Individual cells shown in gray, culture/transfection averages shown in blue (n = 4 transfections). (C) Representative micrographs of HeLa-P1KO cells transfected with TMEM63A(I462N)-BBS/IRES/mCherry prior to incubation with BTX-AF 647 conjugate, as in (A). (D) Quantification of BTX signal at 0 h and 2 h post labeling for conditions with (solid markers) or without (empty markers) conjugate, as in (B) (n = 3 transfections). (E) Representative micrographs of HEK-P1KO cells transfected with Piezo2-BBS/IRES/EGFP prior to incubation with BTX-AF 647 conjugate, as in (A). Arrowheads indicate transfected cells positive for BTX labeling. (F) Quantification of BTX signal at 0 h and 2 h post labeling for conditions with (solid markers) or without (empty markers), as in (B) (n = 3 transfections). Data in (B, D, and F) analyzed by one-way ANOVA followed by Tukey’s multiple comparison). |
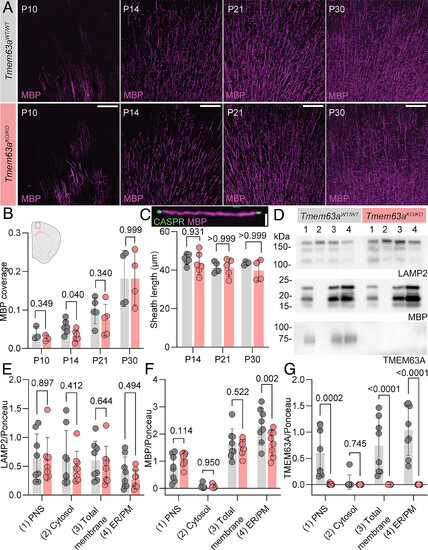
Delayed myelination in Tmem63a-null mice recapitulates the HLD19 phenotype. (A) Representative micrographs of 50 µm-thick cortical sections immunostained against MBP (magenta) from Tmem63aWT/WT (gray labels) and Tmem63aKO/KO (rose labels) mice at indicated ages. (Scale bar, 100 µm.) (B) MBP coverage in cortical sections, as MBP+ area by total area, for Tmem63aWT/WT and Tmem63aKO/KO mice. Inset region of MBP measurement in the cortex (n = 4 to 6 animals per genotype and age, Brown–Forsythe and Welch ANOVA for multiple comparisons). (C) Internode myelin sheath lengths as MBP+ distance between CASPR labeling (Inset), for Tmem63aWT/WT and Tmem63aKO/KO mice. (n = 4 to 6 animals per genotype and age, One-way ANOVA for multiple comparisons). (Scale bar, 5 µm.) (D) Representative immunoblots of fractions isolated from brain tissue of P30 – P90 Tmem63aWT/WT and Tmem63aKO/KO mice. Blots probed for lysosomal protein LAMP2, myelin-associated protein MBP, and TMEM63A. Lanes: 1) postnuclear supernatant [PNS], 2) cytosol, 3) total cellular membranes [inclusive of ER/PM and lysosomes], 4) ER/PM. Quantification of LAMP2 (E), MBP (F), TMEM63A (G) immunoblot signal density normalized to Ponceau S signal density measured between 100 to 150 kDa (n = 8, 2-way ANOVA and Tukey’s multiple comparison testing). |
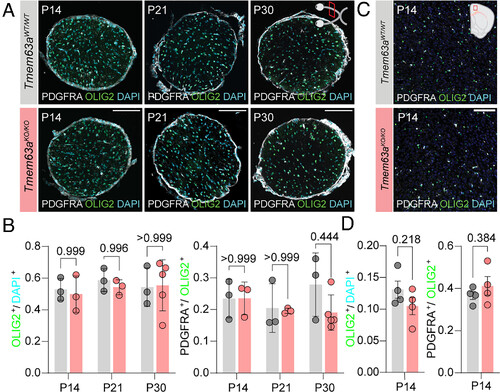
Loss of Tmem63a does not affect OPC and OL populations. (A) Representative micrographs of 14 µm-thick optic nerve sections immunostained against OLIG2 (green) and PDGFRA (gray), and counterstained with DAPI (cyan) from Tmem63aWT/WT and Tmem63aKO/KO mice at P14, P21, and P30. (Scale bar, 100 µm.) (B) Left, percentage OLIG2+ cells/DAPI+ cells in the optic nerve for Tmem63aWT/WT and Tmem63aKO/KO mice. Right, percentage PDGFRA+ cells/OLIG2+ cells in the whole cross section of the optic nerve for Tmem63aWT/WT and Tmem63aKO/KO mice (n = 3 to 5 animals per genotype and age, Brown–Forsythe and Welch ANOVA). (C) Representative micrographs of 16 µm-thick cortical sections immunostained against OLIG2 (green) and PDGFRA (gray), and counterstained with DAPI (cyan) from Tmem63aWT/WT and Tmem63aKO/KO mice at P14. (Scale bar, 100 µm.) (D) Left, percentage OLIG2+ cells/DAPI+ cells in the cortex for Tmem63aWT/WT and Tmem63aKO/KO mice. Right, percentage PDGFRA+ cells/OLIG2+ cells in the cortex for Tmem63aWT/WT and Tmem63aKO/KO mice (n = 4 animals per genotype, unpaired t test). |
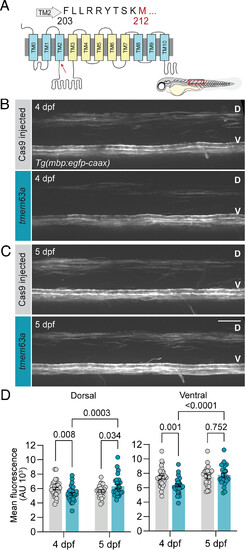
TMEM63A function in myelination is conserved in zebrafish. (A) Topology map of Danio rerio Tmem63a; region targeted by CRISPR/Cas9 flanks M212 (highlighted in red and indicated by the red arrow on the map). Representative micrographs comparing control Cas9 injected or tmem63a sgRNAs injected in Tg(mbp:egfp-caax) fish at 4 dpf (B) and 5 dpf (C). D, dorsal and V, ventral spinal cord. Cartoon larva illustrates ROI (red box). (Scale bar, 25 µm.) (D) Mean mbp:egfp-caax intensity of dorsal (Left) and ventral (Right) spinal cord from z-stack sum projections of Cas9 and tmem63a F0 fish. (n = 25 to 32 animals per crispant and age, mixed effects analysis of multiple comparison by uncorrected Fisher’s LSD). |
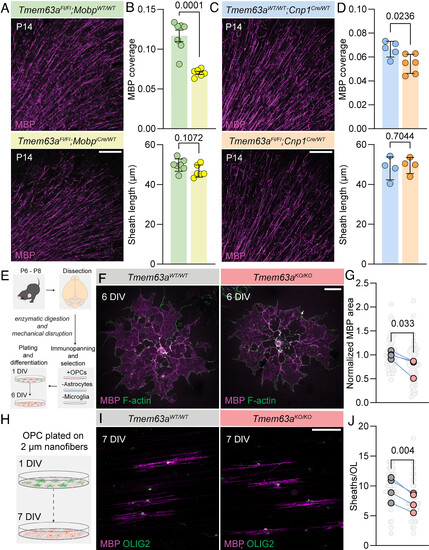
TMEM63A functions cell autonomously in OLs. (A) Representative micrographs of 50 µm-thick cortical sections immunostained against MBP (magenta) from P14 Tmem63aFl/Fl; MobpWT/WT and Tmem63aFl/Fl; MobpiCre/WT mice. (Scale bar, 100 µm.) (B) Top, MBP coverage in cortical sections, as determined by MBP+ area divided by total imaged area, for P14 Tmem63aFl/Fl; MobpWT/WT and Tmem63aFl/Fl; MobpiCre/WT mice (n = 7 animals, unpaired t test). Bottom, Internode myelin sheath lengths for P14 Tmem63aFl/Fl; MobpWT/WT and Tmem63aFl/Fl; MobpiCre/WT mice (n = 7 animals, unpaired t test). (C) Representative micrographs of 50 µm-thick cortical sections immunostained against MBP (magenta) from P14 Tmem63aWT/WT; Cnp1Cre/WT and Tmem63aFl/Fl; Cnp1Cre/WT mice. (Scale bar, 100 µm.) (D) Top, MBP coverage in cortical sections, as MBP+ area by total imaged area, for P14 Tmem63aWT/WT; Cnp1Cre/WT and Tmem63aFl/Fl; Cnp1Cre/WT mice. (n = 5 to 6 animals per genotype, unpaired t test). Bottom, internode myelin sheath lengths for P14 Tmem63aWT/WT; Cnp1Cre/WT (blue) and Tmem63aFl/Fl; Cnp1Cre/WT (orange) mice. (n = 4 animals per genotype, unpaired t test). (E) Schematic for OL isolation and culture. After plating as OPCs, cells were differentiated for 6 d in vitro (DIV) before immunostaining. (F) Representative micrograph of OLs isolated from Tmem63aWT/WT and Tmem63aKO/KO mice, stained with MBP (magenta) and phalloidin for F-actin (green). (Scale bar, 25 µm.) (G) MBP+ area, normalized to average of WT cultures. Individual cells in light gray, culture averages in gray (Tmem63aWT/WT) and rose (Tmem63aKO/KO) (n = 4 cultures per genotype, paired t test). (H) Using the same protocol as indicated in (E), OPCs were plated on 2 µm nanofibers and differentiated for 7 DIV. (I) Representative micrograph of OLs isolated from Tmem63aWT/WT and Tmem63aKO/KO mice and plated on nanofibers, stained with MBP (magenta) and OLIG2 (green). (Scale bar, 25 µm.) (J) Quantification of average sheath number per cell. Individual cells in light gray, culture averages in gray (Tmem63aWT/WT) and rose (Tmem63aKO/KO) (n = 4 animals each genotype, paired t test). |