
Fig. 2
- ID
- ZDB-FIG-250813-23
- Publication
- Halford et al., 2025 - TMEM63A, associated with hypomyelinating leukodystrophies, is an evolutionarily conserved regulator of myelination
- Other Figures
- All Figure Page
- Back to All Figure Page
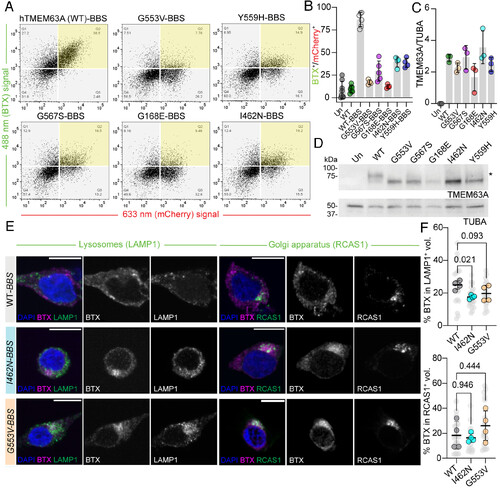
HLD19-associated TMEM63A LOF mutations prevent plasma membrane localization. (A) Representative flow cytometry data plots for cells transfected with WT TMEM63A or indicated mutant, with BBS. Transfected cells identified by mCherry fluorescence (633 nm signal). Surface TMEM63A binding identified by BTX-AF488 fluorescence (488 nm signal). Region of overlap between BTX-labeled and transfected cells highlighted in yellow. (B) Percentage of gating events overlapping between BTX-labeled and transfected cells for WT (with and without BBS) and indicated mutants (with BBS) (n = 4 to 8 transfections per construct, P-values for all comparisons between WT-BBS and mutant-BBS is <0.0001, One-way ANOVA, Kruskal–Wallis test of multiple comparisons). (C) Quantification of TMEM63A immunoblot signal density, normalized to tubulin alpha chain (TUBA) signal density (n = 3 transfections per construct, P-value for all comparisons between WT and mutant is >0.05, One-way ANOVA, Dunnett’s multiple comparisons against WT). (D) Representative immunoblots of lysates prepared from cells transfected with WT TMEM63A or indicated mutant, probed against TMEM63A or TUBA (loading control). * indicates glycosylated band. (E) Representative micrographs of BTX-labeled HEK-P1KO cells transfected with BBS-tagged TMEM63A (WT and selected HLD19-associated variants) costained for LAMP1 (Left) or RCAS1 (Right). BTX (magenta), organelle marker (green), and DAPI (blue) are shown in merged images; BTX and organelle channels are shown separately (grays). (Scale bar, 10 µm.) (F) Percentage total BTX signal density residing in organelle-stained volume for lysosomes (LAMP1+, Top) and Golgi apparatus (RCAS1+, Bottom). Individual cells in light gray, culture/transfection averages in color. One-way ANOVA, Dunnett’s multiple comparisons against WT values (n = 4 transfections per construct/organelle stain). |