
Fig. 4
- ID
- ZDB-FIG-250813-25
- Publication
- Halford et al., 2025 - TMEM63A, associated with hypomyelinating leukodystrophies, is an evolutionarily conserved regulator of myelination
- Other Figures
- All Figure Page
- Back to All Figure Page
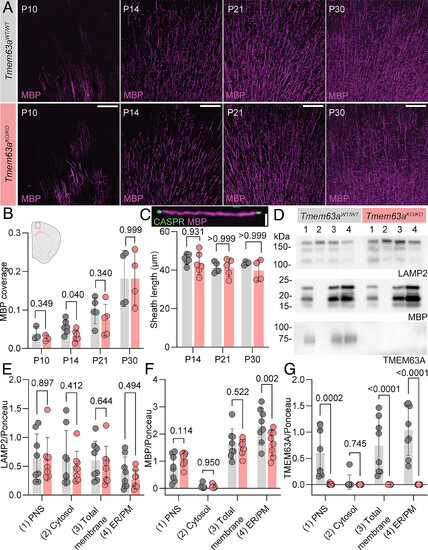
Delayed myelination in Tmem63a-null mice recapitulates the HLD19 phenotype. (A) Representative micrographs of 50 µm-thick cortical sections immunostained against MBP (magenta) from Tmem63aWT/WT (gray labels) and Tmem63aKO/KO (rose labels) mice at indicated ages. (Scale bar, 100 µm.) (B) MBP coverage in cortical sections, as MBP+ area by total area, for Tmem63aWT/WT and Tmem63aKO/KO mice. Inset region of MBP measurement in the cortex (n = 4 to 6 animals per genotype and age, Brown–Forsythe and Welch ANOVA for multiple comparisons). (C) Internode myelin sheath lengths as MBP+ distance between CASPR labeling (Inset), for Tmem63aWT/WT and Tmem63aKO/KO mice. (n = 4 to 6 animals per genotype and age, One-way ANOVA for multiple comparisons). (Scale bar, 5 µm.) (D) Representative immunoblots of fractions isolated from brain tissue of P30 – P90 Tmem63aWT/WT and Tmem63aKO/KO mice. Blots probed for lysosomal protein LAMP2, myelin-associated protein MBP, and TMEM63A. Lanes: 1) postnuclear supernatant [PNS], 2) cytosol, 3) total cellular membranes [inclusive of ER/PM and lysosomes], 4) ER/PM. Quantification of LAMP2 (E), MBP (F), TMEM63A (G) immunoblot signal density normalized to Ponceau S signal density measured between 100 to 150 kDa (n = 8, 2-way ANOVA and Tukey’s multiple comparison testing). |