
- Title
-
2-Hydroxy-4-n-octyloxybenzophenone induces developmental neurotoxicity and multiple sclerosis-like symptoms through cacna1a regulated Ca2 + inward flow and microglial activation
- Authors
- Li, X., Gao, X., Liu, S., Liu, S., Liu, Y., Gao, L., Xia, L., Liu, K., Jin, M.
- Source
- Full text @ Ecotoxicol. Environ. Saf.
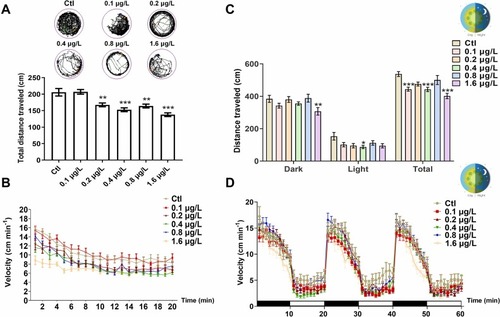
Effects of UV-531 on the locomotion of zebrafish larvae. (A) Representative images of the digital tracks. The black lines indicate slow-speed movement; green lines are linked to medium-speed movement; red lines are associated with high-speed movement. Total travelling distance of different groups of zebrafish. n = 15. (B) Mean speed of UV-531-treated zebrafish at 6 dpf. n = 15. (C) Dark phase, light phase, and total distance traveled in light/dark challenge. n = 24. (D) Travelling speed in the light/dark challenge, which consisted of 3 cycles of light/dark phases (10 min for each phase). n = 24. The tests were repeated 3 time. *p < 0.05, * *p < 0.01, * **p < 0.001 vs. Ctl. |
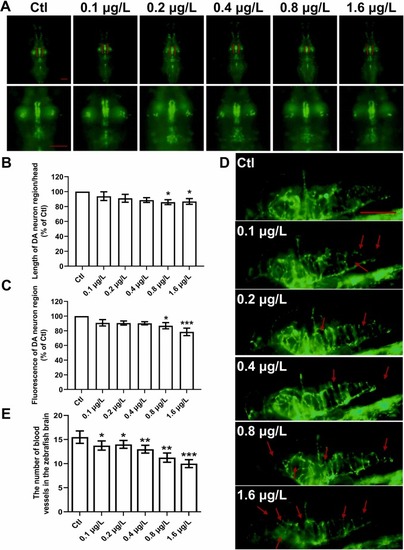
UV-531 induces DA neuron damage, cerebral vessels deficits in zebrafish. (A) Fluorescence microscopy images of slc18a2:GFP zebrafish exposed to UV-531. Red brackets indicate DA neurons. Images were enlarged to improve visualization of DA neuron morphology. Scale bar, 150 μm. n = 15. (B) Statistical analysis of the length of DA neuron/head in each group (% of Ctl). n = 15. (C) Statistical analysis of the fluorescence of DA neuron region (% of Ctl) in each group. n = 15. (D) Representative fluorescence microscopy images of fli1:GFP zebrafish exposed to UV-531 up to 4 dpf. Red arrows indicate vessel damage. Scale bar, 150 μm. n = 15. (E) Statistical analysis of the number of blood vessels in the brain. n = 15. *p < 0.05, * *p < 0.01, * **p < 0.001 vs. Ctl. |
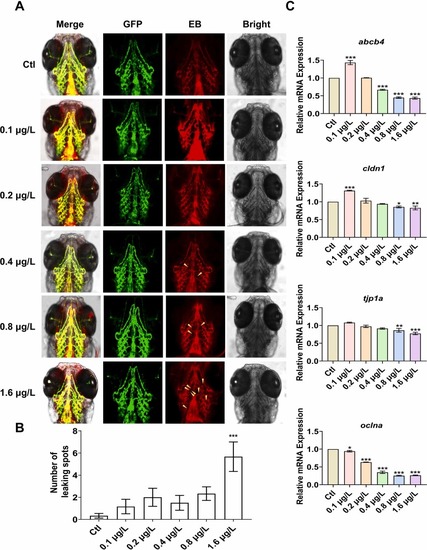
UV-531 induces BBB leakage in zebrafish. (A) Representative images of BBB leakage of fli1:GFP zebrafish exposed to UV-531 up to 5 dpf under fluorescence microscopy. Yellow arrows indicate the plasma protein spots that leak outside the cerebral vessels. Scale bar, 150 μm. n = 15. (B) Statistical analysis of BBB leakage points in the brain of zebrafish in each group. n = 15. (C) Transcription levels of BBB-related genes including abcb4, cldn1, tjp1a, and oclna. n = 30. The tests were repeated 3 times. *p < 0.05, * *p < 0.01, * **p < 0.001 vs. Ctl. |
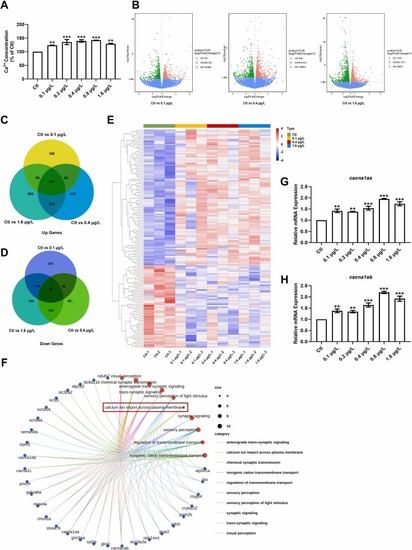
Effects of UV-531 on calcium homeostasis, gene expression profiling, and expression of Ca2+ transport-related gene in zebrafish. (A) Ca2+ concentrations in zebrafish. The tests were repeated 3 times and n = 60 in each group. (B) Volcano plots of the significantly up- regulated and down-regulated DEGs. (C-D) Analysis of DEGs exposed to UV-531 showed that 121 DEGs were up-regulated and 78 DEGs were down-regulated. (E) Heatmap of DEGs including upregulated genes (red) and downregulated genes (blue) in groups Ctl and UV-531 at 0.1, 0.4 and 1.6 μg/L. Values represented in red and blue are based on FPKM values calculated by zero-mean normalization. (F) GO enrichment analysis of DEGs. (G-H) The expression of Ca2+ transport-related genes were detected by real-time qPCR. Transcription levels of calcium channel, voltage-dependent, P/Q type, alpha 1 A subunit, a (cacna1aa) and calcium channel, voltage-dependent, P/Q type, alpha 1 A subunit, b (cacna1ab). The tests were repeated 3 times and n = 30 in each group. * *p < 0.01, * **p < 0.001 vs. Ctl. |
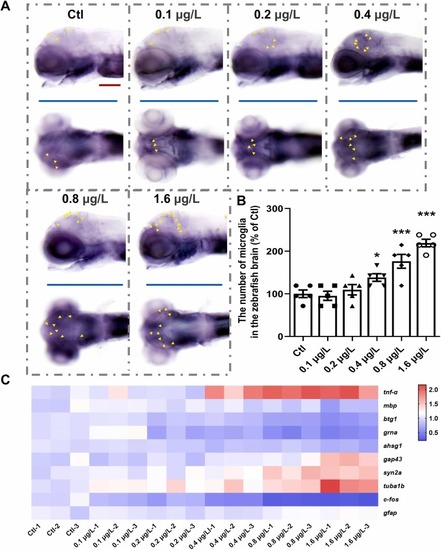
UV-531 induces microglia activation and altered transcription levels of MS-related genes in zebrafish. (A) Expression of the microglia-associated gene apoeb in zebrafish at 6 dpf exposed to environmentally relevant concentrations. Yellow triangles represent microglia. The tests were repeated 3 times and n = 15 in each group. Scale bar, 100 µm. (B) Statistical analysis of the number of microglia in the zebrafish brain (% of Ctl) in each group. n = 15 (C) Heatmap of transcription levels of tnf-α, mbp, btg1, grna, ahsg1, gap43, syn2a, tuba1b, c-fos, and gfap. Red represents increased expression levels, blue represents decreased expression levels and white represents the baseline value. The tests were repeated 3 times and n = 30 in each group. *p < 0.05, * *p < 0.01, * **p < 0.001 vs. Ctl. |
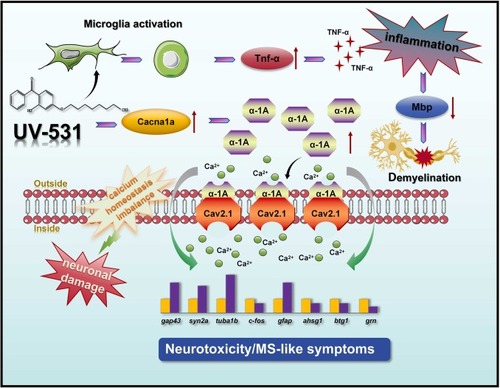
Schematic representation of UV-531-induced developmental neurotoxicity and MS-like symptoms. Exposure to UV-531 induces a significant upregulation of cacna1a, leading to increased Ca2+ inflow, resulting in an imbalance in calcium homeostasis as well as neuronal damage. It also caused microglia activation, inducing an inflammatory environment that drove myelin injure. Thus, UV-531 induced developmental neurotoxicity and MS-like symptoms. |