
|
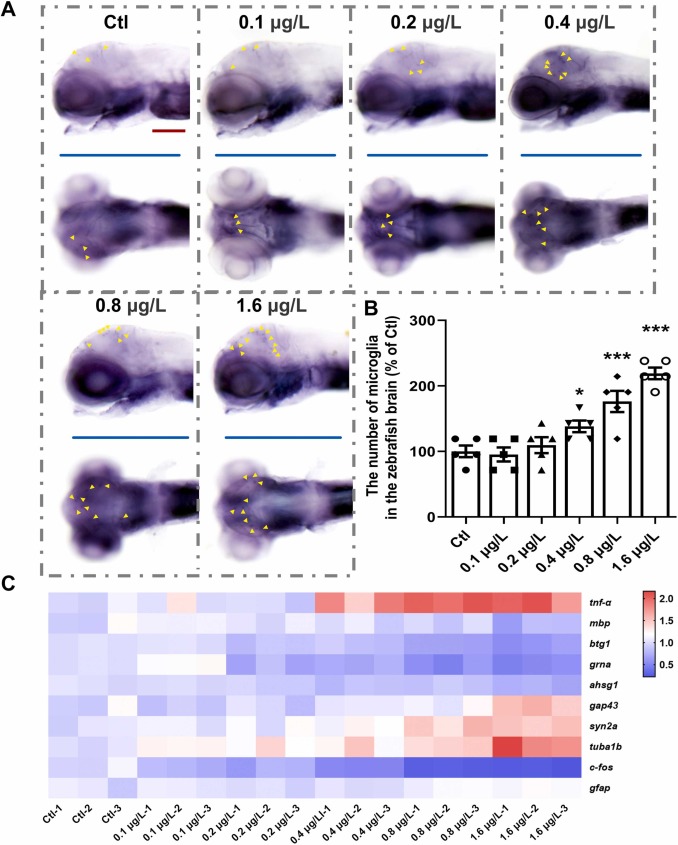
Fig. 5 UV-531 induces microglia activation and altered transcription levels of MS-related genes in zebrafish. (A) Expression of the microglia-associated gene apoeb in zebrafish at 6 dpf exposed to environmentally relevant concentrations. Yellow triangles represent microglia. The tests were repeated 3 times and n = 15 in each group. Scale bar, 100 µm. (B) Statistical analysis of the number of microglia in the zebrafish brain (% of Ctl) in each group. n = 15 (C) Heatmap of transcription levels of tnf-α, mbp, btg1, grna, ahsg1, gap43, syn2a, tuba1b, c-fos, and gfap. Red represents increased expression levels, blue represents decreased expression levels and white represents the baseline value. The tests were repeated 3 times and n = 30 in each group. *p < 0.05, * *p < 0.01, * **p < 0.001 vs. Ctl.