
|
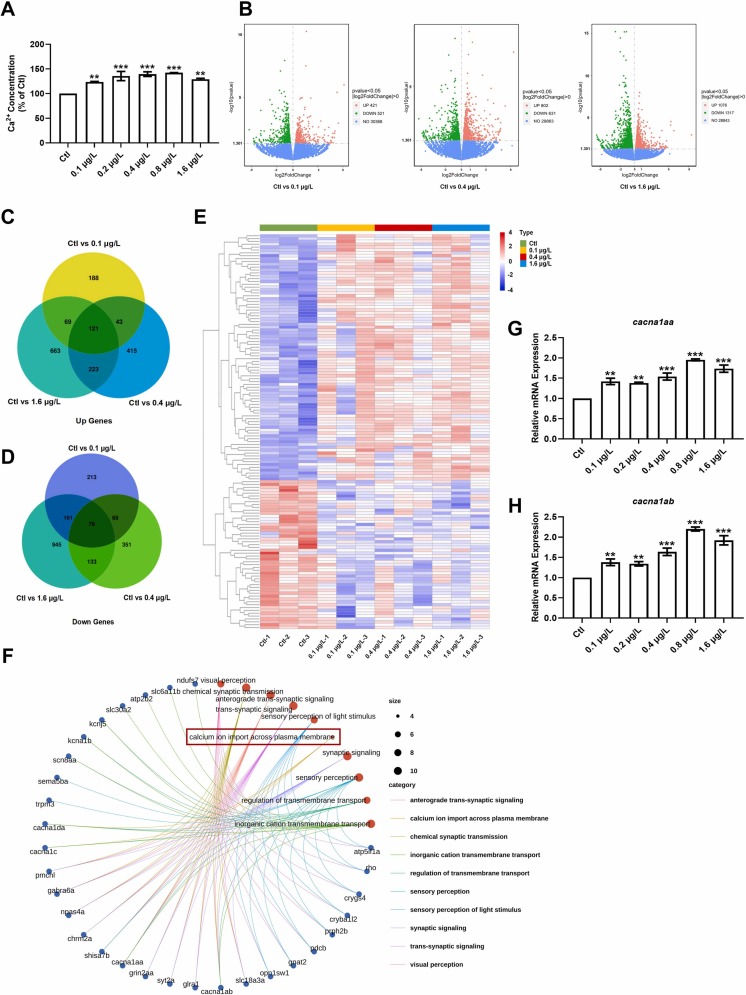
Fig. 4 Effects of UV-531 on calcium homeostasis, gene expression profiling, and expression of Ca2+ transport-related gene in zebrafish. (A) Ca2+ concentrations in zebrafish. The tests were repeated 3 times and n = 60 in each group. (B) Volcano plots of the significantly up- regulated and down-regulated DEGs. (C-D) Analysis of DEGs exposed to UV-531 showed that 121 DEGs were up-regulated and 78 DEGs were down-regulated. (E) Heatmap of DEGs including upregulated genes (red) and downregulated genes (blue) in groups Ctl and UV-531 at 0.1, 0.4 and 1.6 μg/L. Values represented in red and blue are based on FPKM values calculated by zero-mean normalization. (F) GO enrichment analysis of DEGs. (G-H) The expression of Ca2+ transport-related genes were detected by real-time qPCR. Transcription levels of calcium channel, voltage-dependent, P/Q type, alpha 1 A subunit, a (cacna1aa) and calcium channel, voltage-dependent, P/Q type, alpha 1 A subunit, b (cacna1ab). The tests were repeated 3 times and n = 30 in each group. * *p < 0.01, * **p < 0.001 vs. Ctl.