FIGURE SUMMARY
Title

TBK1 is involved in programmed cell death and ALS-related pathways in novel zebrafish models

Authors
Raas, Q., Haouy, G., de Calbiac, H., Pasho, E., Marian, A., Guerrera, I.C., Rosello, M., Oeckl, P., Del Bene, F., Catanese, A., Ciura, S., Kabashi, E.
Source
Full text @ Cell Death Discov

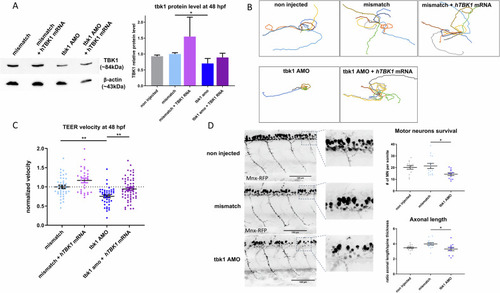
Motor behavior and motor neuron phenotype induced by tbk1 knockdown in zebrafish larvae.

A Western blot quantification (ratio to β-actin level) of tbk1 expression after antisense morpholino oligonucleotide (AMO)- and hTBK1 mRNA injections. B Traces representative of the touch-evoked escape response (TEER) in 48 hpf zebrafish injected with tbk1 or mismatch AMO and hTBK1 mRNA injections. C Quantitative analysis of the TEER velocity of 48 hpf zebrafish larvae injected with tbk1 or mismatch AMO and rescued with mRNA encoding human TBK1. One-way ANOVA with Tukey’s multiple comparisons test was used. *p < 0.05, **p < 0.01). D In vivo quantification of spinal motor neuron axonal length and number in 48 hpf transgenic Tg(mnx1:gal4/UAS:RFP) embryos injected with tbk1 or mismatch AMO.

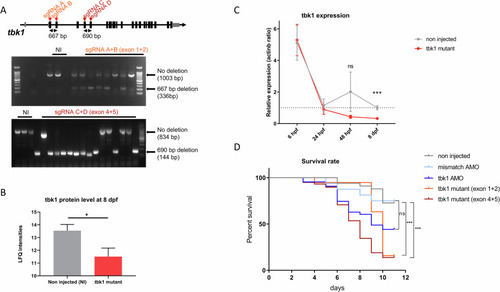
Tbk1 expression and survival in zebrafish larvae with CRISPR-induced deletion of the tbk1 gene.

A Description of CRISPR-Cas9 tandem sgRNA targeting exons 1 and 2 or exons 4 and 5 of the tbk1 gene (top) and genotyping of injected embryos with gel electrophoresis of PCR products amplifying the deleted region. B tbk1 protein quantification by mass spectrometry in zebrafish larvae harboring mosaic tbk1 mutations or their noninjected controls (NIs) (unpaired t test, *p < 0.05). C RT‒qPCR measurement of tbk1 expression in zebrafish larvae with mosaic deletions of the tbk1 gene or NI controls between 6 hpf and 8 dpf (unpaired t test, ***p < 0.001). D Survival rate of zebrafish larvae injected with tbk1 or mismatch AMO (ns), CRISPR-Cas9 sgRNA targeting exons 1 and 2 or exons 4 and 5 of the tbk1 gene or NI controls (log-rank (Mantel‒Cox) test, *** p < 0.001).

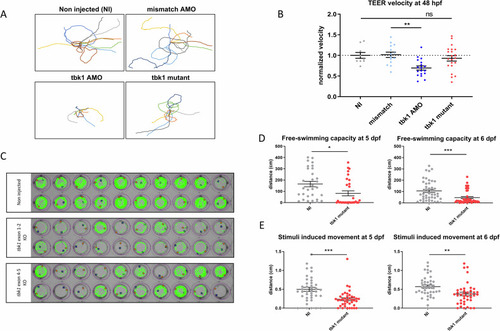
Motor behavior of tbk1 mutant zebrafish larvae.

A Traces representative of the touch-evoked escape response (TEER) in 48 hpf tbk1 mutant, tbk1 or mismatch AMO or NI zebrafish larvae. B Quantitative analysis of the TEER velocity of 48 hpf tbk1 mutant, mismatch or tbk1 AMO or NI zebrafish larvae (one-way ANOVA with Tukey’s multiple comparisons test). *p < 0.05, **p < 0.01). C Representative traces suggestive of motor behavior and swimming trajectories of 5 dpf zebrafish larvae, recorded with a semiautomated video tracking system (Viewpoint Zebrabox). D Quantitative analysis of free-swimming (top panel) or stimuli-induced motor behavior (bottom) in 5 (left) or 6 dpf (right) tbk1 mutant or NI control zebrafish larvae. (Unpaired t test for comparative analysis. *p < 0.05).

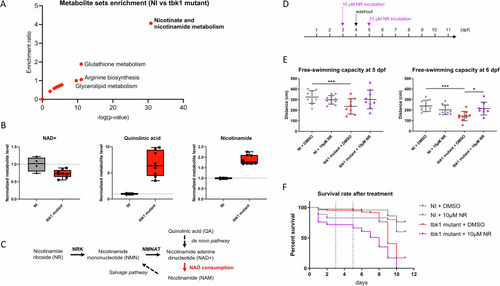
Metabolomic analysis and nicotinamide riboside treatment of tbk1 mutant zebrafish.

A Metabolite set enrichment analysis showing the enrichment ratio and statistical significance of metabolic pathways in 6 dpf tbk1 mutant zebrafish compared to their noninjected controls (over representation analysis using Metaboanalyst 6.0 with significantly affected metabolites, p < 0.01). B Mass spectrometry quantification of NAD + , quinolinic acid and nicotinamide in tbk1 mutant or NI zebrafish (unpaired t test, p = 0.002, p < 0.001 and p < 0.001, respectively). C Schematic representation of the Nicotinamide riboside (NR) and NAD+ salvage pathway affected in tbk1 mutant zebrafish (NRK, nicotinate riboside kinase; NMNAT, nicotinamide mononucleotide adenylyltransferase). D Schematic timeline used for the treatment of tbk1 CRISPR-Cas9-injected or NI zebrafish with 10 µM NR or 0.1% DMSO in zebrafish embryo water. E Quantitative analysis of larval free-swimming motor behavior upon incubation with NR (one-way ANOVA with Tukey’s multiple comparisons test). *p < 0.05, ***p < 0.001). F Survival rate of tbk1 mutant or NI larvae upon incubation with NR.

Proteomic profile and markers of programmed cell death in tbk1 mutant zebrafish.

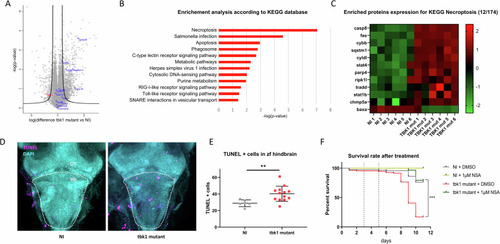
A Volcano plot showing protein enrichment measured by mass spectrometry in tbk1 mutant zebrafish at 8 dpf compared to their NI controls (black line = cutoff for statistical significance). B Pathway enrichment analysis based on KEGG 2019 for significantly enriched proteins measured in tbk1 mutant zebrafish compared to their NI controls. C Heatmap representation of protein levels (row z scores) for significantly enriched proteins associated with the KEGG term necroptosis (hsa04217) in tbk1 mutant and NI zebrafish larvae. D Terminal deoxynucleotidyl transferase dUTP nick end labeling (TUNEL) staining of cells affected by programmed cell death in the larval brain of tbk1 mutant or NI zebrafish at 6 dpf (OT, optic tectum; Hb, hindbrain; dotted line = outline of hindbrain used for quantification). E Quantification of TUNEL-positive cells in the hindbrain of tbk1 mutant or NI zebrafish (unpaired t test, p = 0.0098). F Survival rate of tbk1 mutant or NI larvae upon incubation with the necroptosis inhibitor necrosulfonamide (NSA) at 1 µM or 0.1% DMSO (log-rank (Mantel Cox) test). ***p < 0.001).

Joint proteomic analysis of tbk1 mutants zebrafish and iMNs from ALS patients with TBK1 mutations.

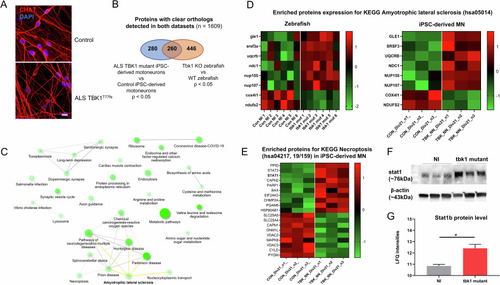
A Fluorescent immunolabeling of the neuronal marker CHAT in differentiated induced pluripotent stem cell-derived motor neurons (iMNs) at day 21 from an ALS patient harboring the loss of function mutation TBK1T77fs compared to control iMNs. B Proteomic profiles of ALS-TBK1 iMNs compared to control iMNs. The differentially expressed protein list was compared to the list of zebrafish orthologs differentially expressed in tbk1-deficient zebrafish larvae, and enrichment analysis was performed on the common list of 260 terms. C Network plot showing the relationship between enriched pathways from TBK1-mutant ALS models. A close interaction between the necroptosis pathway and several neurodegenerative pathways, including the amyotrophic lateral sclerosis (ALS) KEGG pathway, is observed. D Heatmap representation of protein levels (row z scores) for significantly enriched proteins in both datasets associated with the KEGG term ALS in tbk1 mutant vs NI zebrafish and ALS-TBK1 iMNs vs control iMNs. E Heatmap representation of protein levels (row z scores) for significantly enriched proteins associated with the KEGG term necroptosis in ALS-TBK1 iMNs vs control iMNs. F Western blotting of STAT1 expression in tbk1 mutant and NI zebrafish. G Mass spectrometry quantification of stat1b protein level in tbk1 mutant and NI zebrafish.

Acknowledgments
This image is the copyrighted work of the attributed author or publisher, and ZFIN has permission only to display this image to its users. Additional permissions should be obtained from the applicable author or publisher of the image. Full text @ Cell Death Discov