IMAGE

Fig. 6

ID
ZDB-IMAGE-250315-55
Antibodies
Source
Figures for Raas et al., 2025
Image
Figure Caption

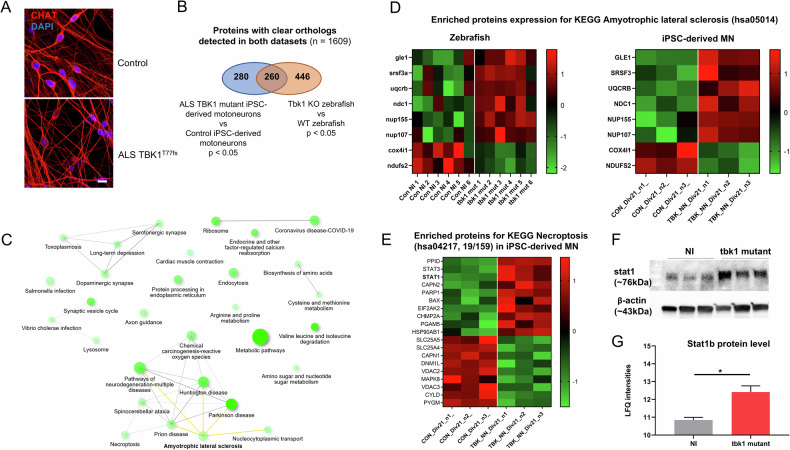
Fig. 6 Joint proteomic analysis of tbk1 mutants zebrafish and iMNs from ALS patients with TBK1 mutations.

A Fluorescent immunolabeling of the neuronal marker CHAT in differentiated induced pluripotent stem cell-derived motor neurons (iMNs) at day 21 from an ALS patient harboring the loss of function mutation TBK1T77fs compared to control iMNs. B Proteomic profiles of ALS-TBK1 iMNs compared to control iMNs. The differentially expressed protein list was compared to the list of zebrafish orthologs differentially expressed in tbk1-deficient zebrafish larvae, and enrichment analysis was performed on the common list of 260 terms. C Network plot showing the relationship between enriched pathways from TBK1-mutant ALS models. A close interaction between the necroptosis pathway and several neurodegenerative pathways, including the amyotrophic lateral sclerosis (ALS) KEGG pathway, is observed. D Heatmap representation of protein levels (row z scores) for significantly enriched proteins in both datasets associated with the KEGG term ALS in tbk1 mutant vs NI zebrafish and ALS-TBK1 iMNs vs control iMNs. E Heatmap representation of protein levels (row z scores) for significantly enriched proteins associated with the KEGG term necroptosis in ALS-TBK1 iMNs vs control iMNs. F Western blotting of STAT1 expression in tbk1 mutant and NI zebrafish. G Mass spectrometry quantification of stat1b protein level in tbk1 mutant and NI zebrafish.

Figure Data
Acknowledgments
This image is the copyrighted work of the attributed author or publisher, and ZFIN has permission only to display this image to its users. Additional permissions should be obtained from the applicable author or publisher of the image. Full text @ Cell Death Discov