IMAGE

Fig. 4

ID
ZDB-IMAGE-250315-52
Source
Figures for Raas et al., 2025
Image
Figure Caption

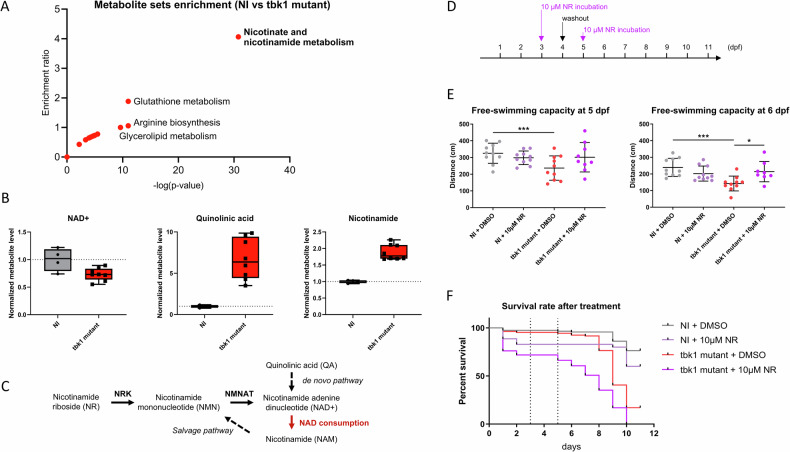
Fig. 4 Metabolomic analysis and nicotinamide riboside treatment of tbk1 mutant zebrafish.

A Metabolite set enrichment analysis showing the enrichment ratio and statistical significance of metabolic pathways in 6 dpf tbk1 mutant zebrafish compared to their noninjected controls (over representation analysis using Metaboanalyst 6.0 with significantly affected metabolites, p < 0.01). B Mass spectrometry quantification of NAD + , quinolinic acid and nicotinamide in tbk1 mutant or NI zebrafish (unpaired t test, p = 0.002, p < 0.001 and p < 0.001, respectively). C Schematic representation of the Nicotinamide riboside (NR) and NAD+ salvage pathway affected in tbk1 mutant zebrafish (NRK, nicotinate riboside kinase; NMNAT, nicotinamide mononucleotide adenylyltransferase). D Schematic timeline used for the treatment of tbk1 CRISPR-Cas9-injected or NI zebrafish with 10 µM NR or 0.1% DMSO in zebrafish embryo water. E Quantitative analysis of larval free-swimming motor behavior upon incubation with NR (one-way ANOVA with Tukey’s multiple comparisons test). *p < 0.05, ***p < 0.001). F Survival rate of tbk1 mutant or NI larvae upon incubation with NR.

Figure Data
Acknowledgments
This image is the copyrighted work of the attributed author or publisher, and ZFIN has permission only to display this image to its users. Additional permissions should be obtained from the applicable author or publisher of the image. Full text @ Cell Death Discov