
- Title
-
Spns1-dependent endocardial lysosomal function drives valve morphogenesis through Notch1-signaling
- Authors
- Chávez, M.N., Arora, P., Meer, M., Marques, I.J., Ernst, A., Morales Castro, R.A., Mercader, N.
- Source
- Full text @ iScience
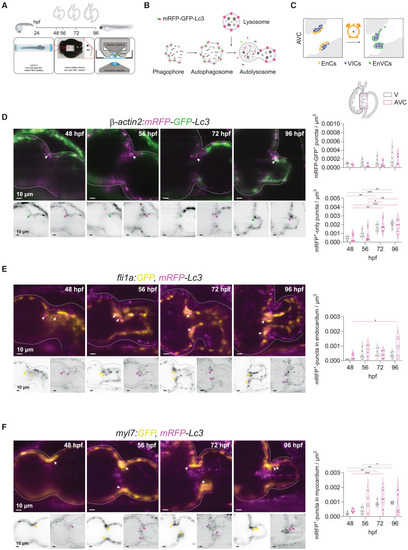
Autophagosome formation accompanies valve development (A) Experimental plan followed for in vivo imaging of the developing zebrafish heart. Transgenic zebrafish larvae were imaged at 48, 56, 72 and 96 hpf upon 3 h treatment with chloroquine (2 mM) to observe autophagosomes and lysosomes in the beating heart using light-sheet microscopy and following a 3D+t acquisition mode. (B) Schematic overview of the process of autophagy-lysosomal degradation involving phagosome and autophagosome formation, fusion with lysosome, and lysosomal degradation. The transgenic autophagosome tagged reporter proteins used in this study are illustrated. (C) Graphic representation of the cardiac region imaged. AVC, atrioventricular canal; EnCs, endocardial cells; VIC, valve interstitial cells; EnVCs, endocardial valve cells. (D–F) Reconstructed image acquisitions by 3D+t light-sheet microscopy. Shown are always merged (color) and single channel views (inverted greyscale). Anterior is to the top, ventricle to the left, atria to the right. Middle part constriction is the AVC. Developmental stages are indicated within the panels as hours postfertilization (hpf). Graphs show number of mRFP-GFP + puncta within ventricle and AVC regions at the different developmental stages. Shown are numbers in individual animals as well as median and quartile values. Each point represents one larva. Statistical test: two-way ANOVA, ∗p ≤ 0.05, ∗∗p ≤ 0.01, ∗∗∗p ≤ 0.001). Scale bars represent 10 μm. (D) Tg(β-actin2:mRFP-GFP-Lc3) larvae show mRFP-GFP+ autophagosomes ubiquitously distributed in the developing heart and accumulation of mRFP+-only autolysosomes in the atrioventricular canal (AVC) during development. Arrows point to double-positive puncta in atrioventricular valves. TgKI(mRFP-Lc3) expresses an mRFP-tagged version of the endogenous autophagosome backbone protein Lc3. This reporter line was crossed into the endocardial Tg(fli1a:GFP) (E) and myocardial Tg(myl7:GFP) (F) lines. Arrows mark mRFP+-puncta in endocardium and myocardium, respectively. See also Figure S2. |
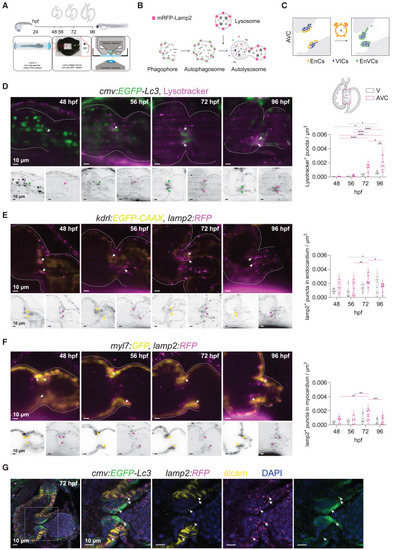
Lysosome accumulation during cardiac valve development (A) Experimental set up for in vivo lysosome imaging in the developing zebrafish heart. Transgenic zebrafish larvae were imaged at 48, 56, 72 and 96 h post fertilization (hpf) using light-sheet microscopy and following a 3D+t acquisition mode. (B) Schematic overview of the process of autophagy-lysosomal degradation involving phagosome and autophagosome formation, fusion with lysosome, and lysosomal degradation. Lysosomes were tracked using LysoTracker or a transgenic reporter line expressing lamp2 fused with red fluorescent protein mRFP. (C) Graphic representation of the cardiac region imaged, corresponding to the atrioventricular canal (AVC). EnCs, endocardial cells; VIC, valve interstitial cells; EnVCs, endocardial valve cells. (D–F) Reconstructed live image acquisitions by 3D+t light-sheet microscopy. Shown are optical sections through hearts at the indicated developmental stages. Anterior is to the top, the ventricle to the left and atria to the right. Upper panels show merged channels (color), lower panels single channels (inverted greyscale). Arrows mark mRFP+-puncta in the atrioventricular valves. Graphs show quantification of fluorescent puncta in the ventricle and AVC regions at different developmental stages. Shown are numbers in individual animals as well as median and quartile values. Each dot represents one larva. Statistical test: two-way ANOVA, ∗p ≤ 0.05, ∗∗p ≤ 0.01, ∗∗∗p ≤ 0.001, ∗∗∗∗p ≤ 0.0001). Scale bars represent 10 μm. (D) Tg(cmv:EGFP-Lc3) embryos were stained with LysoTracker to observe GFP+ autophagosome and LysoTracker+ acidic lysosomal vesicles in the developing heart. Note that EGFP signal is also strongly detected in circulating erythrocytes between 48 and 56 hpf, but later localizes mainly to the in AVC. LysoTracker-labelled lysosomes are scarcely observed before 56 hpf in cardiac tissues, but accumulate in the AVC at 72 hpf and are prominent in the developing valves at 96 hpf. (E and F) The lysosome reporter Tg(lamp2:RFP) was crossed into Tg(fli1:GFP) (E) or Tg(myl7:GFP) (F) to assess lysosomes colocalization in endocardium and myocardium, respectively. (G) Cardiac sections of Tg(cmv:GFP-LC3); (lamp2:RFP) immunostained for GFP (green), RFP (magenta) and ALCAM (yellow). Arrows point to RFP/GFP double positive puncta. ALCAM staining allows to demarcate the myocardium at the AVC. Scale bars represent 10 μm. See also Figure S3. |
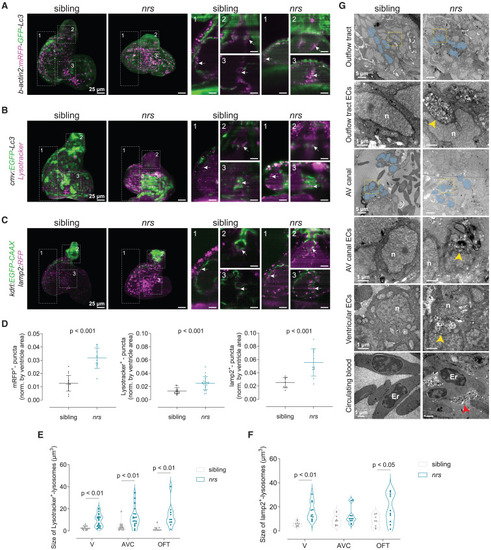
Impaired lysosomal degradation in the developing nrs-mutant heart (A–C) The transgenic lines Tg(β-actin2:mRFP-GFP-Lc3), Tg(cmv:EGFP-Lc3) and Tg(kdlr:EGFP-CAAX);(lamp2:RFP) were crossed into the nrs mutant background to assess autophagic processing in the larval heart at 3 days postfertilization (dpf) by light-sheet microscopy. Projections and optical sections of reconstructed 3D+t acquisitions are shown. White arrows point to mRFP+ autophagosomes/autolysosomes and lysosomes accumulating at different regions of the heart. Scale bars represent 25 μm. (D) The number of puncta was estimated for mRFP+-autophagosomes/autolysosomes, LysoTracker+ lysosomes and lamp2+ lysosomes and normalized to the ventricle cross-sectional area. The results show a significant accumulation of all autophagic vesicles in nrs-mutant hearts compared to their siblings, which indicates an impairment in autophagic flux. Data are represented as mean ± SD. Each dot represents one larva. Statistical analysis was performed using Welch’s t-test. Scale bars represent 25 μm. (E and F) Graphs showing the quantification of average lysosomal size in different cardiac areas (Ventricle, V; AVC and OFT) in wildtype siblings and nrs mutants. Each dot represents one larva. Shown are also median and quartiles. Statistical analysis was performed using two-way ANOVA. (G) Transmission electron microscopy of 4 dpf mutant and sibling hearts. Note the presence of massive lysosomal compartments with partially degraded contents in nrs hearts (yellow arrowheads), mostly in endothelial cells in the OFT and AVC (N = 3). Sibling ventricular and atrioventricular endocardial valve cells (blue-colored nuclei) show a characteristic cuboidal shape that was not visible in nrs endocardial cells at the AVC and outflow tract (OFT). In nrs mutants, the cardiac lumen was filled with lysosomal-derived contents (red arrowheads). Er, erythrocyte; n, nucleus. Scale bars represent 1 μm in the overview images and 0.5 μm in the zoom-in images (yellow rectangles). See also Figure S4. |
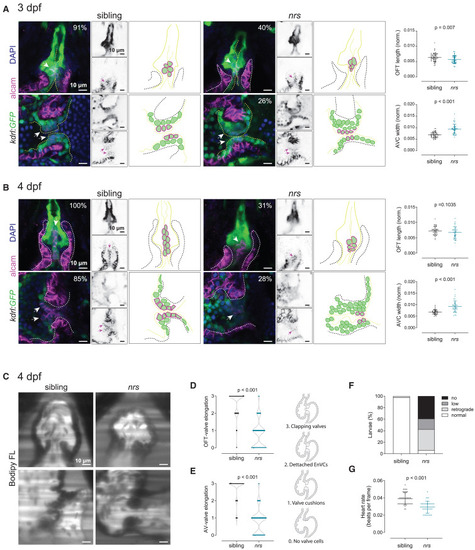
nrs mutant have abnormal valve development and function (A and B) Cardiac morphology and valve development was evaluated in Tg(kdrl:GFP) transgenic nrs mutants between 3 and 4 dpf. Confocal microscopy images of whole mount larval hearts immunostained for GFP (endocardium) and ALCAM (myocardium and endocardial valve cells). Nuclei are counterstained with DAPI. Arrows point to ALCAM+ endocardial valve cells within the atrioventricular canal (AVC) and outflow tract (OFT). Right panels show a schematic representation of the observed phenotypic alterations in nrs compared to siblings. When normalized to the ventricle cross-sectional area, the length of the OFT in the mutant heart was proportionally smaller at 3 dpf in nrs larvae, whereas the AVC was significantly wider compared to their siblings at both experimental time-points. Most sibling hearts displayed ALCAM+-organized primitive valve layers at 3 dpf (OFT 91%, AVC 73%; total siblings = 22) and aligned Acam+-valve endothelial cells at 4 dpf (OFT 100%, AVC 85%; total sibling = 19). In contrast, ALCAM+-endocardial cells were rarely observed in mutant larvae both at 3 dpf (OFT 40%, AVC 26% total nrs = 18) and 4 dpf (OFT 31%, AVC 28%; total nrs = 20) and the organization of valve endothelial cells was lost by 4 dpf. Data are represented as mean ± SD. Each dot represents one larva. Statistical analysis was performed using Mann-Whitney-U test. Scale bars represent 10 μm. (C) To evaluate valve function and blood flow, sibling and mutant larvae were immersed in BODIPY FL C5-Ceramide, a green-fluorescent dye which counterstains the blood plasma and live imaged by light-sheet microscopy. Scale bars represent 10 μm. Qualitative parameters were considered to evaluate (D) OFT- and (E) AV-valve elongation and function (0: no valve cells; 1: valve cushions, 2: delaminated valve cells, 3: elongated clapping valves). Each dot represents one valve. Chi-square test was applied to analyze differences between experimental groups. (F) Percentage of larvae presenting normal, low, retrograde or no blood flow. (G) Heart rate was calculated from the number of beats during the acquisition of 150 frames. Data are represented as mean ± SD. Each dot represents one larva. Statistical analysis was performed using Mann-Whitney-U test. |
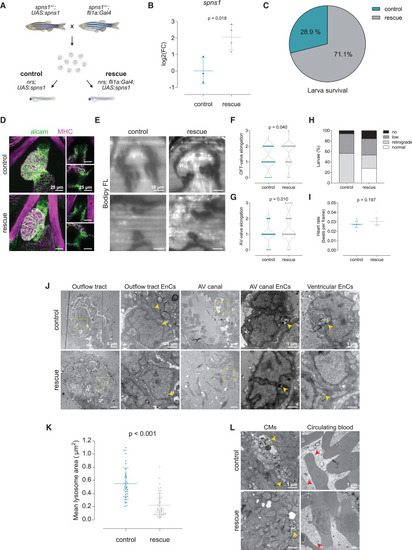
Endothelial specific overexpression of spns1 rescues valve development and function (A) To address the endocardial-specific susceptibility toward lysosomal impairment, a rescue strategy based on the endothelial-specific overexpression of the wild-type spns1 gene was implemented. For this, single transgenic heterozygous parents (spns1+/−;fli1a:Gal4 and spns1+/−;UAS:spns1) were crossed to obtain control (nrs;UAS:spns1) and rescue (nrs;fli1a:Gal4; UAS:spns1) larvae. (B) Overexpression of the spns1 was verified by qPCR. Data are represented as mean ± SD. Each dot represents a pool of larvae. (C) Larval survival percentage at 4 dpf for each experimental group. (D) Confocal microscopy images of whole-mount immunostaining of larval hearts show enhanced ALCAM staining in the OFT and AVC in rescued hearts. Scale bars represent 25 μm. (E) Light-sheet microscopy of BODIPY FL C5 -stained larvae was performed to evaluate cardiac and valve function. Scale bars represent 10 μm. (F) OFT- and (G) AV-valve elongation and function were evaluated qualitatively (0: no valve cells; 1: valve cushions, 2: delaminated valve cells, 3: elongated clapping valves). Each dot represents one valve. Chi-square test was applied to analyze differences between experimental groups. (H) Percentage of larvae presenting normal, low, retrograde or no blood flow. (I) Heart rate was calculated from the number of beats during the acquisition of 150 frames. Statistical analysis was performed using Mann-Whitney-U test. Data are represented as mean ± SD. Each dot represents one larva. (J and K) Transmission electron microscopy revealed a reduction in the accumulation of partially degraded lysosomal contents in endocardial cells of rescued larvae (yellow arrowheads), and a partial restoration of endocardial morphology. Per experimental group N ≥ 3 larvae and N ≥ 8 images of endocardial cells per larva were considered for the analysis. Data are represented as mean ± SD. Each dot represents one lysosome. Statistical analysis was performed using Mann-Whitney-U test. Scale bars represent 5 or 1 μm as indicated in the upper panels. (L) Accumulation of lysosomal contents seemed to be reduced in myocardial cells (CMs, yellow arrowheads, yet lysosomal contents in the blood plasma were still present in the rescue group (red arrowheads). Scale bar length is defined in the upper panel (control). |
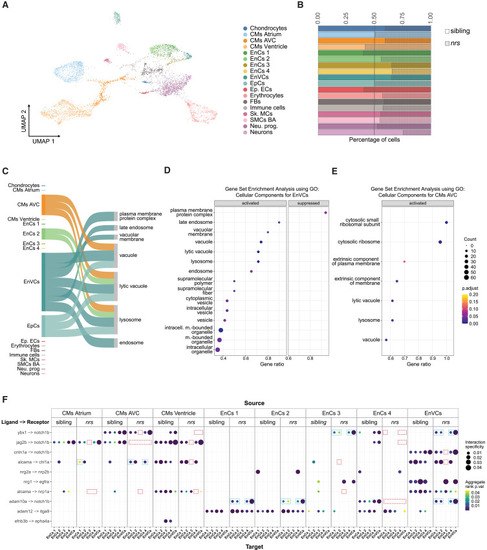
Expression of lysosome related genes and notch1b-signalling is affected in nrs-mutants Results obtained from a snRNA transcriptome analysis of sibling and nrs mutant hearts at 3 dpf. (A) UMAP showing the various identified cell types from the snRNA-seq performed for mutant and sibling hearts at 3 dpf. (B) The proportion of different cell types observed in sibling versus mutant suggest that lysosomal impairment above all affects the representation of atrioventricular cardiomyocytes (CMs AVC), three endocardial populations (EnCs 3, EnCs 4) among them endocardial valve cells (EnVCs) and neurons in the larval heart. (C) Sankey diagram illustrates the cell-specificity of overrepresented lysosomal and membrane related gene pathways found in nrs mutants compared to siblings highlighting the relevance of lysosomal degradation in EnVCs. The width of the arrows is proportional to the number of differentially expressed genes in each cell cluster contributing to the pathway. (D and E) Gene set Enrichment Analysis using the differentially expressed genes between siblings versus mutants in EnVCs (D) and atrioventricular CMs (E), where ‘activated’ and ‘suppressed’ represent the pathways that are activated or suppressed in the mutant condition. The results obtained suggest an upregulated transcriptional response in mutant EnVCs and atrioventricular CMs to compensate impaired lysosomal function. (F) Ligand-receptor analysis from LIANA depicting the ligands from the source cells (top) to target cells (bottom) with ligand and receiving receptor shown on the y axis in the sibling and the mutant conditions. The ligand-receptor interactions affecting notch1b- and alcama-signaling are highlighted for the nrs mutant (red square = missing interaction, blue square = differing interaction). |
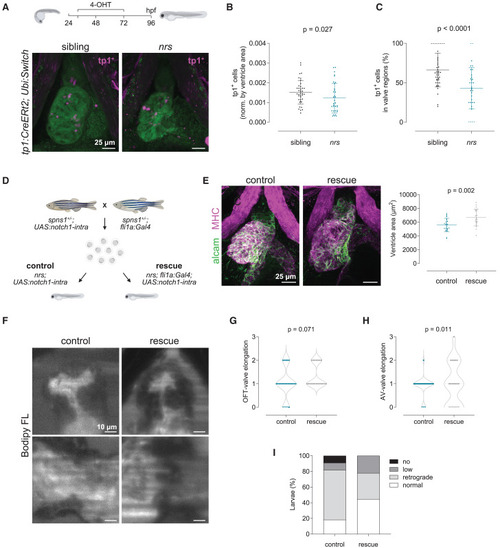
Endothelial specific overexpression of notch1 rescues heart development and function (A) Lineage tracing analysis using the tamoxifen (4-OHT) inducible notch1-activity fate mapping line Tg(tp1:CreERT2) revealed a lower number of tp1+-derived cells in the mutant heart, confirming reduced notch1 signaling. Stack projections of whole mount immunostained hearts imaged by confocal microscopy are shown. Scale bars represent 25 μm. (B and C) Quantification of tp1-mCherry positive cells in the ventricle (B) and AVC/OFT valve regions (C) of siblings vs. nrs mutants. Data are represented as mean ± SD. Each dot represents one larva. Statistical analysis was performed using Mann-Whitney-U test. (D) Endothelial-cell specific overexpression of a constitutively active form of the Notch1 receptor in nrs larvae was achieved by outcrossing heterozygous single transgenic parents (spns1+/−, Tg(fli1a:Gal4) and spns1+/−, Tg(UAS:notch1-intra)). Rescue of the cardiac phenotypes observed in the mutant hearts was evaluated between control (nrs, Tg(UAS:notch1-intra)) and rescue (nrs, Tg(fli1a:Gal4; UAS:notch1-intra)) conditions. (E) Whole-mount immunostaining of control and rescued nrs hearts showed that notch1 overexpression significantly increased the ventricle size of the mutants (MHC: Myosin heavy chain). Each dot represents one larva. Data are represented as mean ± SD. Statistical analysis was performed using Welch’s t-test. Scale bars represent 25 μm. (F–H) Cardiac and valve function was evaluated in BODIPY FL C5 -stained larvae using light-sheet microscopy. Scale bars represent 10 μm. Qualitative parameters were considered to evaluate OFT- (G) and AV-valve (H) elongation and function (0: no valve cells; 1: valve cushions, 2: delaminated valve cells, 3: elongated clapping valves). Each dot represents one valve. Chi-square test was applied to analyze differences between experimental groups. (I) Percentage of larvae presenting normal, low, retrograde or no blood flow. |