
Fig. 4
- ID
- ZDB-FIG-250211-4
- Publication
- Chávez et al., 2024 - Spns1-dependent endocardial lysosomal function drives valve morphogenesis through Notch1-signaling
- Other Figures
- All Figure Page
- Back to All Figure Page
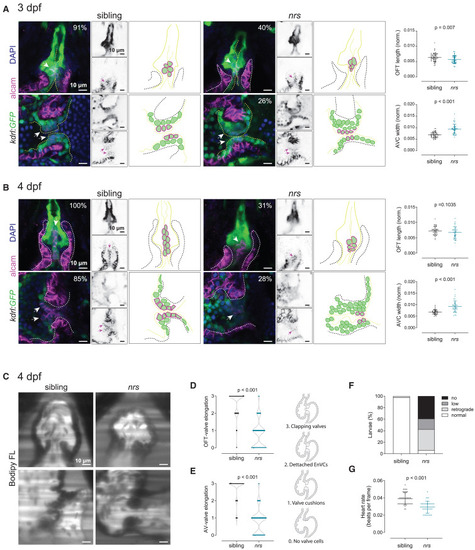
nrs mutant have abnormal valve development and function (A and B) Cardiac morphology and valve development was evaluated in Tg(kdrl:GFP) transgenic nrs mutants between 3 and 4 dpf. Confocal microscopy images of whole mount larval hearts immunostained for GFP (endocardium) and ALCAM (myocardium and endocardial valve cells). Nuclei are counterstained with DAPI. Arrows point to ALCAM+ endocardial valve cells within the atrioventricular canal (AVC) and outflow tract (OFT). Right panels show a schematic representation of the observed phenotypic alterations in nrs compared to siblings. When normalized to the ventricle cross-sectional area, the length of the OFT in the mutant heart was proportionally smaller at 3 dpf in nrs larvae, whereas the AVC was significantly wider compared to their siblings at both experimental time-points. Most sibling hearts displayed ALCAM+-organized primitive valve layers at 3 dpf (OFT 91%, AVC 73%; total siblings = 22) and aligned Acam+-valve endothelial cells at 4 dpf (OFT 100%, AVC 85%; total sibling = 19). In contrast, ALCAM+-endocardial cells were rarely observed in mutant larvae both at 3 dpf (OFT 40%, AVC 26% total nrs = 18) and 4 dpf (OFT 31%, AVC 28%; total nrs = 20) and the organization of valve endothelial cells was lost by 4 dpf. Data are represented as mean ± SD. Each dot represents one larva. Statistical analysis was performed using Mann-Whitney-U test. Scale bars represent 10 μm. (C) To evaluate valve function and blood flow, sibling and mutant larvae were immersed in BODIPY FL C5-Ceramide, a green-fluorescent dye which counterstains the blood plasma and live imaged by light-sheet microscopy. Scale bars represent 10 μm. Qualitative parameters were considered to evaluate (D) OFT- and (E) AV-valve elongation and function (0: no valve cells; 1: valve cushions, 2: delaminated valve cells, 3: elongated clapping valves). Each dot represents one valve. Chi-square test was applied to analyze differences between experimental groups. (F) Percentage of larvae presenting normal, low, retrograde or no blood flow. (G) Heart rate was calculated from the number of beats during the acquisition of 150 frames. Data are represented as mean ± SD. Each dot represents one larva. Statistical analysis was performed using Mann-Whitney-U test. |