
Fig. 3
- ID
- ZDB-FIG-250211-3
- Publication
- Chávez et al., 2024 - Spns1-dependent endocardial lysosomal function drives valve morphogenesis through Notch1-signaling
- Other Figures
- All Figure Page
- Back to All Figure Page
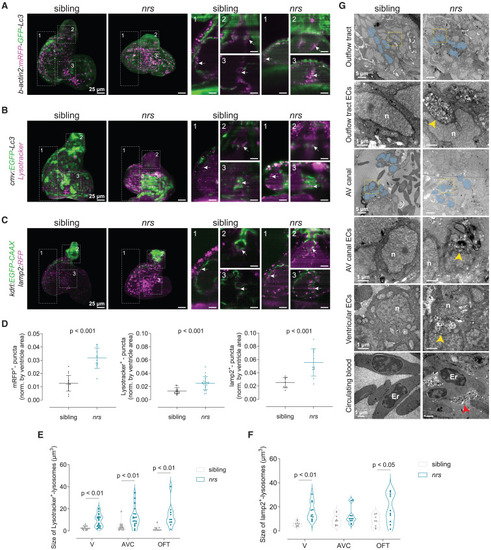
Impaired lysosomal degradation in the developing nrs-mutant heart (A–C) The transgenic lines Tg(β-actin2:mRFP-GFP-Lc3), Tg(cmv:EGFP-Lc3) and Tg(kdlr:EGFP-CAAX);(lamp2:RFP) were crossed into the nrs mutant background to assess autophagic processing in the larval heart at 3 days postfertilization (dpf) by light-sheet microscopy. Projections and optical sections of reconstructed 3D+t acquisitions are shown. White arrows point to mRFP+ autophagosomes/autolysosomes and lysosomes accumulating at different regions of the heart. Scale bars represent 25 μm. (D) The number of puncta was estimated for mRFP+-autophagosomes/autolysosomes, LysoTracker+ lysosomes and lamp2+ lysosomes and normalized to the ventricle cross-sectional area. The results show a significant accumulation of all autophagic vesicles in nrs-mutant hearts compared to their siblings, which indicates an impairment in autophagic flux. Data are represented as mean ± SD. Each dot represents one larva. Statistical analysis was performed using Welch’s t-test. Scale bars represent 25 μm. (E and F) Graphs showing the quantification of average lysosomal size in different cardiac areas (Ventricle, V; AVC and OFT) in wildtype siblings and nrs mutants. Each dot represents one larva. Shown are also median and quartiles. Statistical analysis was performed using two-way ANOVA. (G) Transmission electron microscopy of 4 dpf mutant and sibling hearts. Note the presence of massive lysosomal compartments with partially degraded contents in nrs hearts (yellow arrowheads), mostly in endothelial cells in the OFT and AVC (N = 3). Sibling ventricular and atrioventricular endocardial valve cells (blue-colored nuclei) show a characteristic cuboidal shape that was not visible in nrs endocardial cells at the AVC and outflow tract (OFT). In nrs mutants, the cardiac lumen was filled with lysosomal-derived contents (red arrowheads). Er, erythrocyte; n, nucleus. Scale bars represent 1 μm in the overview images and 0.5 μm in the zoom-in images (yellow rectangles). See also Figure S4. |