
Fig. 7
- ID
- ZDB-FIG-250211-7
- Publication
- Chávez et al., 2024 - Spns1-dependent endocardial lysosomal function drives valve morphogenesis through Notch1-signaling
- Other Figures
- All Figure Page
- Back to All Figure Page
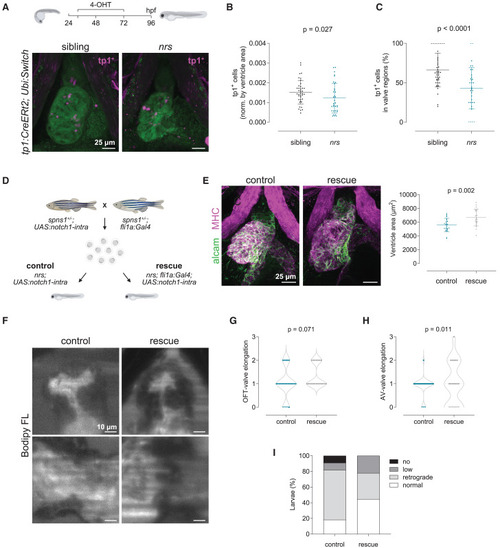
Endothelial specific overexpression of notch1 rescues heart development and function (A) Lineage tracing analysis using the tamoxifen (4-OHT) inducible notch1-activity fate mapping line Tg(tp1:CreERT2) revealed a lower number of tp1+-derived cells in the mutant heart, confirming reduced notch1 signaling. Stack projections of whole mount immunostained hearts imaged by confocal microscopy are shown. Scale bars represent 25 μm. (B and C) Quantification of tp1-mCherry positive cells in the ventricle (B) and AVC/OFT valve regions (C) of siblings vs. nrs mutants. Data are represented as mean ± SD. Each dot represents one larva. Statistical analysis was performed using Mann-Whitney-U test. (D) Endothelial-cell specific overexpression of a constitutively active form of the Notch1 receptor in nrs larvae was achieved by outcrossing heterozygous single transgenic parents (spns1+/−, Tg(fli1a:Gal4) and spns1+/−, Tg(UAS:notch1-intra)). Rescue of the cardiac phenotypes observed in the mutant hearts was evaluated between control (nrs, Tg(UAS:notch1-intra)) and rescue (nrs, Tg(fli1a:Gal4; UAS:notch1-intra)) conditions. (E) Whole-mount immunostaining of control and rescued nrs hearts showed that notch1 overexpression significantly increased the ventricle size of the mutants (MHC: Myosin heavy chain). Each dot represents one larva. Data are represented as mean ± SD. Statistical analysis was performed using Welch’s t-test. Scale bars represent 25 μm. (F–H) Cardiac and valve function was evaluated in BODIPY FL C5 -stained larvae using light-sheet microscopy. Scale bars represent 10 μm. Qualitative parameters were considered to evaluate OFT- (G) and AV-valve (H) elongation and function (0: no valve cells; 1: valve cushions, 2: delaminated valve cells, 3: elongated clapping valves). Each dot represents one valve. Chi-square test was applied to analyze differences between experimental groups. (I) Percentage of larvae presenting normal, low, retrograde or no blood flow. |