
|
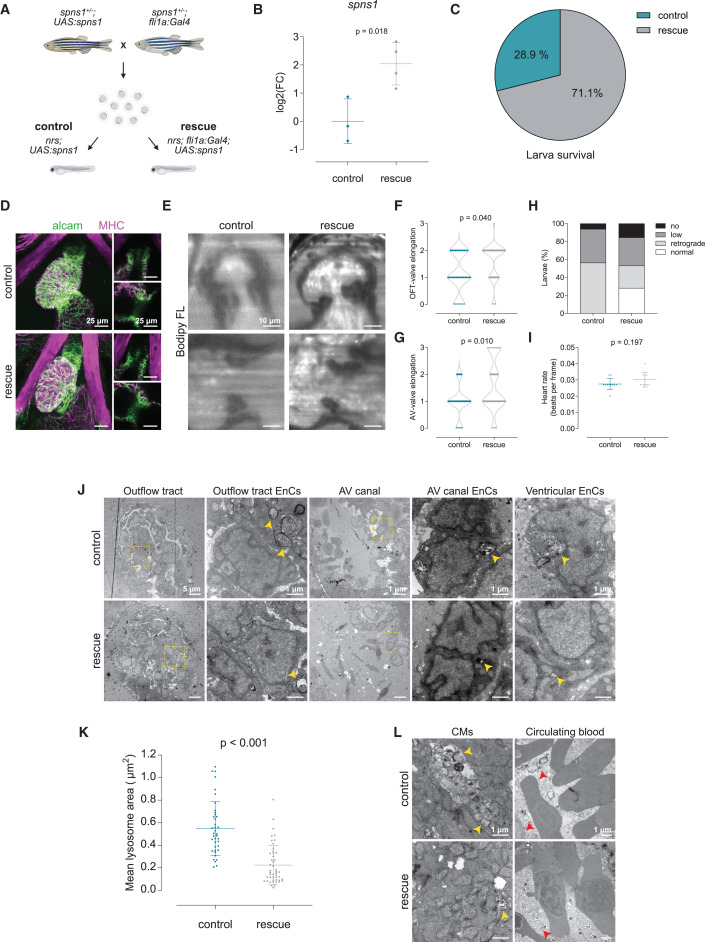
Fig. 5 Endothelial specific overexpression of spns1 rescues valve development and function (A) To address the endocardial-specific susceptibility toward lysosomal impairment, a rescue strategy based on the endothelial-specific overexpression of the wild-type spns1 gene was implemented. For this, single transgenic heterozygous parents (spns1+/−;fli1a:Gal4 and spns1+/−;UAS:spns1) were crossed to obtain control (nrs;UAS:spns1) and rescue (nrs;fli1a:Gal4; UAS:spns1) larvae. (B) Overexpression of the spns1 was verified by qPCR. Data are represented as mean ± SD. Each dot represents a pool of larvae. (C) Larval survival percentage at 4 dpf for each experimental group. (D) Confocal microscopy images of whole-mount immunostaining of larval hearts show enhanced ALCAM staining in the OFT and AVC in rescued hearts. Scale bars represent 25 μm. (E) Light-sheet microscopy of BODIPY FL C5 -stained larvae was performed to evaluate cardiac and valve function. Scale bars represent 10 μm. (F) OFT- and (G) AV-valve elongation and function were evaluated qualitatively (0: no valve cells; 1: valve cushions, 2: delaminated valve cells, 3: elongated clapping valves). Each dot represents one valve. Chi-square test was applied to analyze differences between experimental groups. (H) Percentage of larvae presenting normal, low, retrograde or no blood flow. (I) Heart rate was calculated from the number of beats during the acquisition of 150 frames. Statistical analysis was performed using Mann-Whitney-U test. Data are represented as mean ± SD. Each dot represents one larva. (J and K) Transmission electron microscopy revealed a reduction in the accumulation of partially degraded lysosomal contents in endocardial cells of rescued larvae (yellow arrowheads), and a partial restoration of endocardial morphology. Per experimental group N ≥ 3 larvae and N ≥ 8 images of endocardial cells per larva were considered for the analysis. Data are represented as mean ± SD. Each dot represents one lysosome. Statistical analysis was performed using Mann-Whitney-U test. Scale bars represent 5 or 1 μm as indicated in the upper panels. (L) Accumulation of lysosomal contents seemed to be reduced in myocardial cells (CMs, yellow arrowheads, yet lysosomal contents in the blood plasma were still present in the rescue group (red arrowheads). Scale bar length is defined in the upper panel (control).