FIGURE SUMMARY
Title

DHODH Inhibition Suppresses MYC and Inhibits the Growth of Medulloblastoma in a Novel In Vivo Zebrafish Model

Authors
Tsea, I., Olsen, T.K., Polychronopoulos, P.A., Tümmler, C., Sykes, D.B., Baryawno, N., Dyberg, C.
Source
Full text @ Cancers

DHODH is expressed in MB. (A,B) mRNA expression of DHODH in 763 patients with MB (Cavalli dataset) stratified into molecular subgroups (wnt, shh, group 3, and group 4) and molecular subtypes (shh alpha, shh beta, shh gamma, shh delta, wnt alpha, wnt beta, group 3 alpha, group 3 beta, group 3 gamma, group 4 alpha, group 4 beta, group 4 gamma). For the cohort shown in A, n = 763 primary MBs, including group 3, n = 144; group 4, n = 326; shh, n = 223; and wnt, n = 70. For the cohort shown in B, n = 763, primary MBs including group 4 alpha, n = 98 (p = 9.68 × 10⁻¹¹); group 4 gamma, n = 119 (p = 2.49 × 10⁻⁸); group 3 alpha, n = 67 (p = 4.11 × 10⁻⁶); group 4 beta, n = 109 (p = 2.56 × 10⁻⁶); wnt alpha, n = 49 (p = 9.99 × 10⁻⁵); group 3 beta, n = 37 (p = 7.99 × 10⁻⁴); shh gamma, n = 47 (p = 1.09 × 10⁻³); shh beta, n = 35 (p = 8.99 × 10⁻³); wnt beta, n = 21 (p = 0.051); shh delta, n = 76 (p = 0.778); shh alpha, n = 65 (p = 0.892); and group 3 gamma, n = 40. p values from one-way ANOVA across the four MB subgroups or subtypes, respectively, are shown. * p < 0.05, ** p < 0.01, *** p < 0.001 (C,D) The overall survival of group 3 MB patients separated by median DHODH expression in two publicly available datasets. For the cohort shown in C, the Williamson dataset was used with n = 331 primary MBs, including group 3, n = 52. For the cohort shown in D, the Cavalli dataset was used with n = 763 primary MBs, including group 3, n = 113. Red, DHODH above median (high); blue, DHODH below median (low). Groups are compared using the log-rank test. (E) A raincloud plot showing the average mRNA expression of DHODH in group 3 medulloblastoma patients stratified according to metastatic disease status using the Cavalli dataset. (F) The correlation of DHODH with MYC in group 3 medulloblastoma patients using the Cavalli dataset, n = 144, group 3 primary medulloblastomas. (G) The correlation of DHODH with MYC in group 3 medulloblastoma patients showing no MYC amplification, using the Williamson dataset, n = 37, group 3 primary medulloblastomas with no MYC amplification.

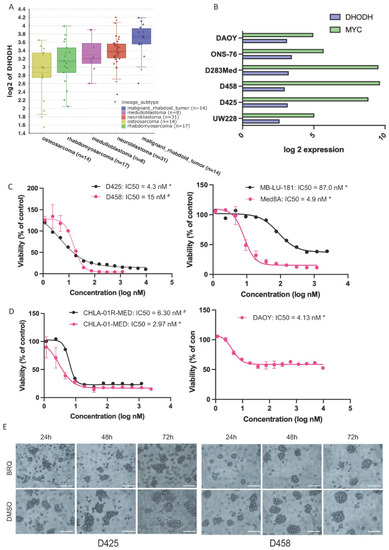
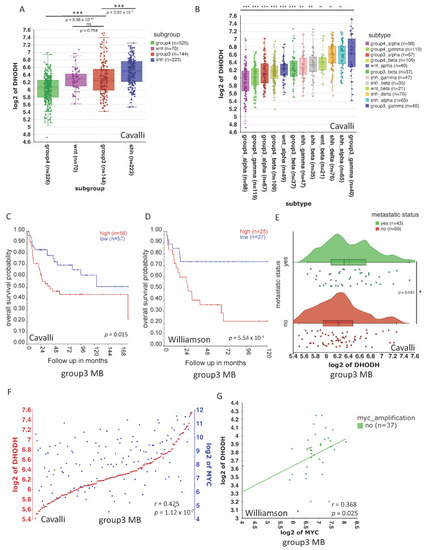
MB cell lines express DHODH and are sensitive to pharmacological treatment with BRQ. (A) DHODH expression in paediatric tumour cell lines of the CCLE dataset, grouped by primary disease. (B) DHODH and MYC expression in medulloblastoma cell lines of the CCLE dataset. (C,D) Dose-response curves for cell viability (assessed by WST1 assay) after 72 h of BRQ treatment in a panel of seven medulloblastoma cell lines. shh: DAOY, Group 3: D425, D458, MB-LU-181, Med8A; and Group 4: CHLA-01-MED, CHLA-01R-MED. Cell lines marked as primary * or metastatic #. (E) Examples of compromised tumour aggregate formation of the suspension cell lines (E) D425 and D458 after pharmacological treatment with BRQ IC50 for 72 h. Cells were images at 10× magnification. Scale bars, 100 μm.

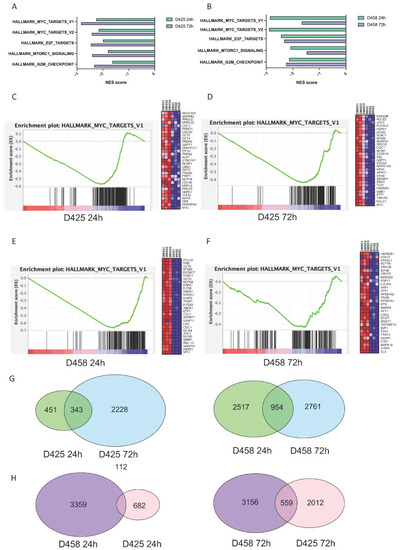
BRQ treatment has a sustained inhibition of MYC target expression. (A,B) Normalised enrichment scores (NESs) of significantly downregulated gene sets using gene set enrichment analysis (GSEA) of RNA-Seq data in BRQ-treated (single-treatment with IC50) cell lines D425 and D458 after 24 h and 72 h treatment with single-treatment of BRQ IC50. Gene set names from MSigDB (Hallmarks and CGP) are provided on the y axis. Negative NES indicates significant downregulation. (CF) NESs of significantly deregulated MYC target genes from the GSEA of RNA-Seq data in BRQ-treated medulloblastoma cell lines D425 and D458. Left panels: GSEA enrichment plot demonstrating MYC target gene downregulation (MSigDB Hallmarks MYC target v1 gene set) in BRQ-treated cell lines, which is maintained at 24 h after 1 dose of BRQ (for C: NES = −2.25, NOM P = 0.000, FDR q = 0.000; for D: NES = −2.84, NOM P = 0.000, FDR q = 0.000; for E: NES = −2.86, NOM P = 0.000, FDR q = 0.000; for F: NES = −1.67, NOM P = 0.000, FDR q = 0.004). Right panels: heatmap enrichment scores of top deregulated MYC target genes in BRQ-treated cell lines at 72 h after 1 dose of BRQ. (G,H) Venn diagrams of differentially expressed genes (DEGs) in BRQ-treated MB cell lines D425 and D458. (G) After 24 h and 72 h treatment with single-treatment of BRQ IC50. (H) DEGs according to treatment timepoint (24 h vs. 72 h) and according to cell line (D425 vs. D458) (for (G,H): Adj p < 0.05).

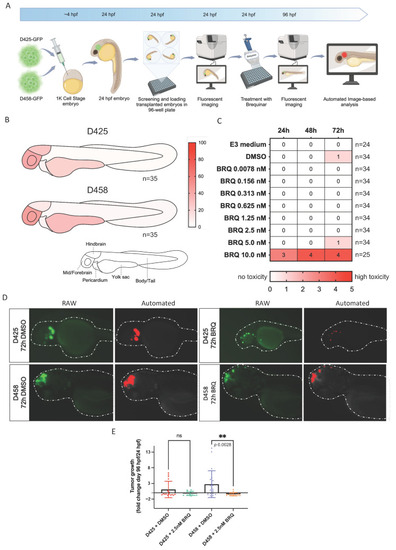
BRQ treatment inhibits tumour growth in a group 3 MB zebrafish xenograft model. (A) Schematic overview of group 3 MB xenografts in zebrafish. D425 and D458 cell lines were transduced with green fluorescent protein (GFP), FACS-sorted, and injected into the 1K cell stage of zebrafish embryos, monitored until 24 h post-fertilization (hpf) for successful transplantation, and selected for exposure to treatments. Zebrafish embryos transplanted with either D425 or D458 were treated with vehicle or BRQ (2.5 nM) for 72 h, and tumour areas were imaged before treatment (24 hpf) and after 72 h treatment (96 hpf). (B) Schematic heatmaps of the tumour cell location of transplanted group 3 cell lines in 48 hpf old embryos. 1 = hindbrain area; 2 = mid/forebrain area; 3 = pericardium area; 4 = yolk sac area; 5 = body and tail area. (C) 24 hpf zebrafish embryos were exposed to sequentially increasing BRQ concentrations to deduce maximum tolerance. Toxicity was noted at 24 h, 48 h, and 72 h after single-treatment with BRQ, DMSO, or E3 medium, and scored between 0 (no toxicity, white) and 5 (instant, lethal toxicity, red). (D) Representative images of included transplanted zebrafish embryos after 72 h treatment with BRQ or vehicle (DMSO). Left panel: raw images showing homing of transplanted cell lines in green. Right panel: accurate identification of transplanted cells by our automated image-based pipeline in red. (E) Tumour growth from automated image-based analyses in transplanted zebrafish embryos, expressed as fold-change 96 hpf/24 hpf. The mean fold-change ± SD is presented (D425 + BRQ 2.5 nM n = 16, D425 + DMSO n = 15, D458 + BRQ 2.5 nM n = 21, D458 + DMSO n = 18). One-way ANOVA showed significant growth inhibition, only for D458, after treatment with 2.5 nM BRQ, p = 0.0028 (comparisons with vehicle for D425, p = 0.2537). ** p < 0.01.

Acknowledgments
This image is the copyrighted work of the attributed author or publisher, and ZFIN has permission only to display this image to its users. Additional permissions should be obtained from the applicable author or publisher of the image. Full text @ Cancers