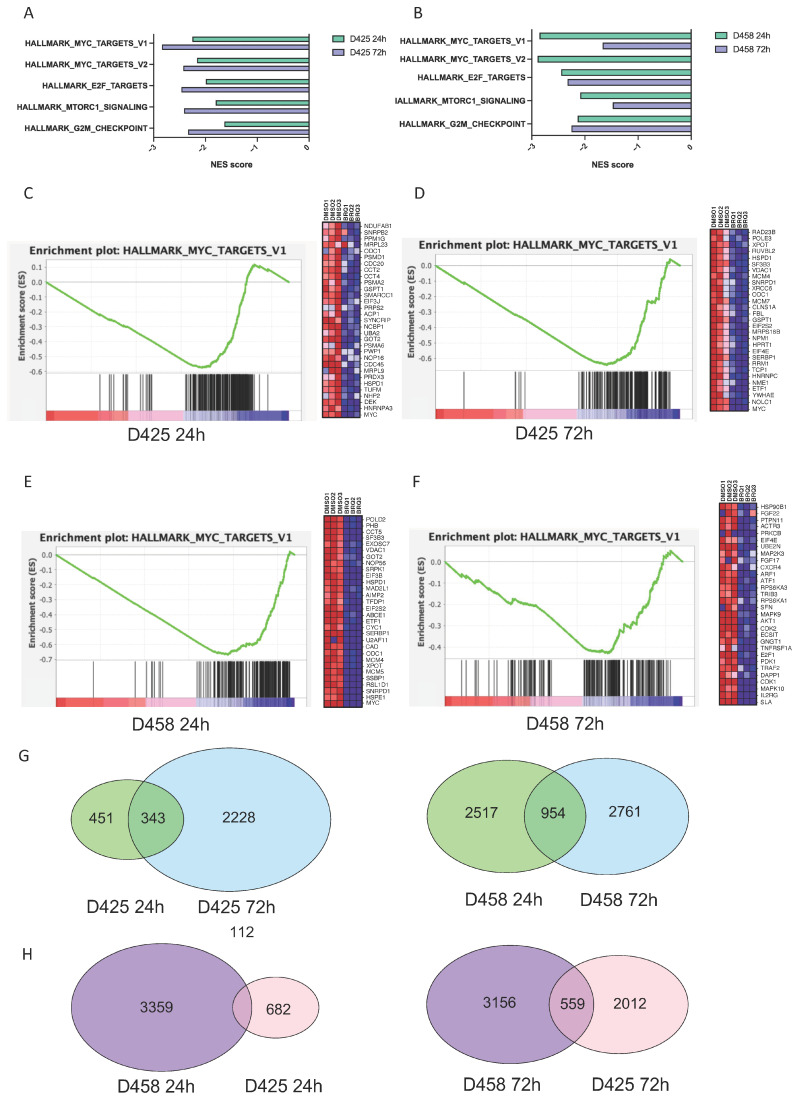
BRQ treatment has a sustained inhibition of MYC target expression. (A,B) Normalised enrichment scores (NESs) of significantly downregulated gene sets using gene set enrichment analysis (GSEA) of RNA-Seq data in BRQ-treated (single-treatment with IC50) cell lines D425 and D458 after 24 h and 72 h treatment with single-treatment of BRQ IC50. Gene set names from MSigDB (Hallmarks and CGP) are provided on the y axis. Negative NES indicates significant downregulation. (C–F) NESs of significantly deregulated MYC target genes from the GSEA of RNA-Seq data in BRQ-treated medulloblastoma cell lines D425 and D458. Left panels: GSEA enrichment plot demonstrating MYC target gene downregulation (MSigDB Hallmarks MYC target v1 gene set) in BRQ-treated cell lines, which is maintained at 24 h after 1 dose of BRQ (for C: NES = −2.25, NOM P = 0.000, FDR q = 0.000; for D: NES = −2.84, NOM P = 0.000, FDR q = 0.000; for E: NES = −2.86, NOM P = 0.000, FDR q = 0.000; for F: NES = −1.67, NOM P = 0.000, FDR q = 0.004). Right panels: heatmap enrichment scores of top deregulated MYC target genes in BRQ-treated cell lines at 72 h after 1 dose of BRQ. (G,H) Venn diagrams of differentially expressed genes (DEGs) in BRQ-treated MB cell lines D425 and D458. (G) After 24 h and 72 h treatment with single-treatment of BRQ IC50. (H) DEGs according to treatment timepoint (24 h vs. 72 h) and according to cell line (D425 vs. D458) (for (G,H): Adj p < 0.05).
Acknowledgments
This image is the copyrighted work of the attributed author or publisher, and
ZFIN has permission only to display this image to its users.
Additional permissions should be obtained from the applicable author or publisher of the image.
Full text @ Cancers
Your Input Welcome
Thank you for submitting comments. Your input has been emailed to ZFIN curators who may contact you if
additional information is required.
Oops. Something went wrong. Please try again later.