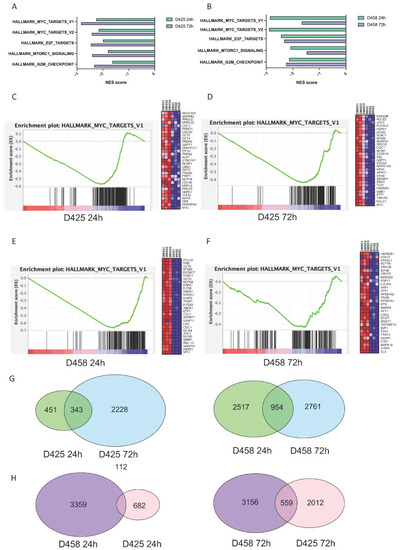
BRQ treatment has a sustained inhibition of MYC target expression. (A,B) Normalised enrichment scores (NESs) of significantly downregulated gene sets using gene set enrichment analysis (GSEA) of RNA-Seq data in BRQ-treated (single-treatment with IC50) cell lines D425 and D458 after 24 h and 72 h treatment with single-treatment of BRQ IC50. Gene set names from MSigDB (Hallmarks and CGP) are provided on the y axis. Negative NES indicates significant downregulation. (C–F) NESs of significantly deregulated MYC target genes from the GSEA of RNA-Seq data in BRQ-treated medulloblastoma cell lines D425 and D458. Left panels: GSEA enrichment plot demonstrating MYC target gene downregulation (MSigDB Hallmarks MYC target v1 gene set) in BRQ-treated cell lines, which is maintained at 24 h after 1 dose of BRQ (for C: NES = −2.25, NOM P = 0.000, FDR q = 0.000; for D: NES = −2.84, NOM P = 0.000, FDR q = 0.000; for E: NES = −2.86, NOM P = 0.000, FDR q = 0.000; for F: NES = −1.67, NOM P = 0.000, FDR q = 0.004). Right panels: heatmap enrichment scores of top deregulated MYC target genes in BRQ-treated cell lines at 72 h after 1 dose of BRQ. (G,H) Venn diagrams of differentially expressed genes (DEGs) in BRQ-treated MB cell lines D425 and D458. (G) After 24 h and 72 h treatment with single-treatment of BRQ IC50. (H) DEGs according to treatment timepoint (24 h vs. 72 h) and according to cell line (D425 vs. D458) (for (G,H): Adj p < 0.05).
|
