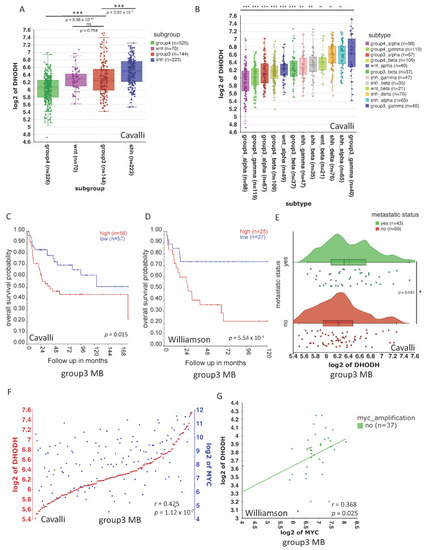
DHODH is expressed in MB. (A,B) mRNA expression of DHODH in 763 patients with MB (Cavalli dataset) stratified into molecular subgroups (wnt, shh, group 3, and group 4) and molecular subtypes (shh alpha, shh beta, shh gamma, shh delta, wnt alpha, wnt beta, group 3 alpha, group 3 beta, group 3 gamma, group 4 alpha, group 4 beta, group 4 gamma). For the cohort shown in A, n = 763 primary MBs, including group 3, n = 144; group 4, n = 326; shh, n = 223; and wnt, n = 70. For the cohort shown in B, n = 763, primary MBs including group 4 alpha, n = 98 (p = 9.68 × 10⁻¹¹); group 4 gamma, n = 119 (p = 2.49 × 10⁻⁸); group 3 alpha, n = 67 (p = 4.11 × 10⁻⁶); group 4 beta, n = 109 (p = 2.56 × 10⁻⁶); wnt alpha, n = 49 (p = 9.99 × 10⁻⁵); group 3 beta, n = 37 (p = 7.99 × 10⁻⁴); shh gamma, n = 47 (p = 1.09 × 10⁻³); shh beta, n = 35 (p = 8.99 × 10⁻³); wnt beta, n = 21 (p = 0.051); shh delta, n = 76 (p = 0.778); shh alpha, n = 65 (p = 0.892); and group 3 gamma, n = 40. p values from one-way ANOVA across the four MB subgroups or subtypes, respectively, are shown. * p < 0.05, ** p < 0.01, *** p < 0.001 (C,D) The overall survival of group 3 MB patients separated by median DHODH expression in two publicly available datasets. For the cohort shown in C, the Williamson dataset was used with n = 331 primary MBs, including group 3, n = 52. For the cohort shown in D, the Cavalli dataset was used with n = 763 primary MBs, including group 3, n = 113. Red, DHODH above median (high); blue, DHODH below median (low). Groups are compared using the log-rank test. (E) A raincloud plot showing the average mRNA expression of DHODH in group 3 medulloblastoma patients stratified according to metastatic disease status using the Cavalli dataset. (F) The correlation of DHODH with MYC in group 3 medulloblastoma patients using the Cavalli dataset, n = 144, group 3 primary medulloblastomas. (G) The correlation of DHODH with MYC in group 3 medulloblastoma patients showing no MYC amplification, using the Williamson dataset, n = 37, group 3 primary medulloblastomas with no MYC amplification.
|
