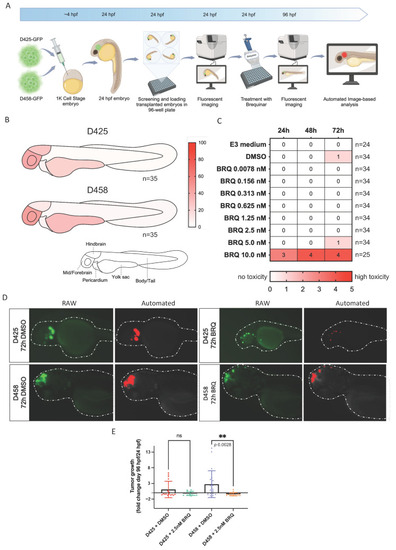
BRQ treatment inhibits tumour growth in a group 3 MB zebrafish xenograft model. (A) Schematic overview of group 3 MB xenografts in zebrafish. D425 and D458 cell lines were transduced with green fluorescent protein (GFP), FACS-sorted, and injected into the 1K cell stage of zebrafish embryos, monitored until 24 h post-fertilization (hpf) for successful transplantation, and selected for exposure to treatments. Zebrafish embryos transplanted with either D425 or D458 were treated with vehicle or BRQ (2.5 nM) for 72 h, and tumour areas were imaged before treatment (24 hpf) and after 72 h treatment (96 hpf). (B) Schematic heatmaps of the tumour cell location of transplanted group 3 cell lines in 48 hpf old embryos. 1 = hindbrain area; 2 = mid/forebrain area; 3 = pericardium area; 4 = yolk sac area; 5 = body and tail area. (C) 24 hpf zebrafish embryos were exposed to sequentially increasing BRQ concentrations to deduce maximum tolerance. Toxicity was noted at 24 h, 48 h, and 72 h after single-treatment with BRQ, DMSO, or E3 medium, and scored between 0 (no toxicity, white) and 5 (instant, lethal toxicity, red). (D) Representative images of included transplanted zebrafish embryos after 72 h treatment with BRQ or vehicle (DMSO). Left panel: raw images showing homing of transplanted cell lines in green. Right panel: accurate identification of transplanted cells by our automated image-based pipeline in red. (E) Tumour growth from automated image-based analyses in transplanted zebrafish embryos, expressed as fold-change 96 hpf/24 hpf. The mean fold-change ± SD is presented (D425 + BRQ 2.5 nM n = 16, D425 + DMSO n = 15, D458 + BRQ 2.5 nM n = 21, D458 + DMSO n = 18). One-way ANOVA showed significant growth inhibition, only for D458, after treatment with 2.5 nM BRQ, p = 0.0028 (comparisons with vehicle for D425, p = 0.2537). ** p < 0.01.
|
