Generation of zebrafish abca4 mutants by using CRISPR/Cas9. (A) Shown is a sequence in exon 3 of the abca4a gene on chromosome 24 (NCBI: Gene ID: 798993) that was targeted with a synthetic guide RNA. Two mutant alleles – abca4aca30 (ca30) and abca4aca31 (ca31) − that disrupt a HaeIII restriction site, were identified and mutant lines established. Both mutant alleles disrupt the reading frame through addition of 21 (ca30) or 31 (ca31) missense residues, thereby truncating at a position equivalent to amino acid (aa) 112 or 122 in WT. (B) Shown is a sequence in exon 3 of the abca4b gene on chromosome 2 (NCBI: Gene ID: 555506) that was targeted with a synthetic guide RNA. The single mutant allele abca4bca33 (ca33) that creates a novel PspGI restriction site, was identified and the mutant line established. Allele ca33 is predicted to disrupt the reading frame through addition of eight missense aa, before truncating at a position equivalent to aa 75 in WT. Synthetic guide RNA sequences are shown in green; Cas9 protospacer adjacent motif (PAM) sequences are shown in red. (C) Confocal z-projection (z=2.82 µm) of the photoreceptor layer in the retina of Tg(rpe65a:tdTomato);Tg(SWS1:EGFP) zebrafish aged 1 year. The retinal pigmented epithelium (RPE) expressing tdTomato (red), UV cones express EGFP (pseudo-colored violet). Green cone outer segment (COS) regions were stained for Green Opsin (green); phagosomes of green COS ingested by RPE microvilli are visible as green ‘spheres’ distal to green COS, which are transported to the RPE cell bodies for digestion. Nuclei are shown in blue (DAPI). Scale bar: 10 µm. (D) Schematic of the photoreceptor layer showing photoreceptor types (yellow rods, green cones, red cones, blue cones, UV cones), RPE (brown), rod outer segment (ROS) region, cone outer segment (COS) region and photoreceptor nuclei (PRN), i.e. outer nuclear region (ONL) region in zebrafish retina. Green dots indicate phagosomes of green COS ingested by RPE microvilli.

Abca4 protein location. (A) Confocal z-projections (z=2.5 µm) of the photoreceptor layer stained for Abca4 (green) in retinas obtained from 2-month-old wild-type, or abca4aca30/ca30, abca4bca33/ca33, abca4aca30/ca30;abca4bca33/ca33 and abca4aca31/ca31;abca4bca33/ca33 mutant zebrafish. Nuclei (white) were labeled with DAPI. Regions of rod outer segments (ROS) and cone outer segment (COS) are indicated by red brackets. (B,C) Confocal z-projections (z=5.4 µm) of photoreceptor layers from 4-month-old wild-type zebrafish co-stained for Abca4 (green) and either Green Opsin (red) or PNA (red) (B or C, respectively). Nuclei (blue) were labeled with DAPI. Encircled areas show examples of COS phagosomes stained for Abca4. (D) Confocal xy-slice view of the photoreceptor layer obtained from a 2-month-old wild-type fish, co-stained for Abca4 (green), acetylated tubulin (red) and Green Opsin (white). Numbers in red (on right) indicate the two xz-slice views (z=5.3 µm) that are shown below. (E,F) 3D-volume projections of COS obtained from 4-month-old wild-type zebrafish co-stained for Abca4 (green) and either green opsin (red; E) or PNA (red; F). Arrow in E indicates the COS that is volume-filled rendered in G and G′. (G,G′) To reveal protein colocalization, the single green COS, indicated by the arrow in E, is shown as a volume-filled rendering of Abca4 and Green Opsin antibody staining. Staining for Green Opsin (cyan) and Abca4 (purple) is shown in G; G′ shows staining for Green Opsin (red) as well as colocalized Green Opsin and Abca4 (yellow), with the latter largely being buried under area shown in purple in G. Scale bars: 10 µm (A,B,D), 5 µm (E,F), 1 µm (G).

Morphology of COS, ROS and RPE in retinas of 2-month-old zebrafish. (A-F) Confocal z-projections of COS, ROS and RPE in retinas obtained from wild-type or abca4aca30/ca30, abca4bca33/ca33, abca4aca30/ca30;abca4bca33/ca33 and abca4aca31/ca31;abca4bca33/ca33 mutant zebrafish. (A) Green COS stained for Green Opsin (green; z=3 µm), (B) red COS stained for PNA (red; z=3 µm), (C) blue COS stained for Blue Opsin (cyan; z=3.4 µm), (D) UV cones expressing EGFP stained for GFP (violet; z=4.4 µm), (E) ROS stained for rhodopsin (white; z=1.9 µm) and (F) RPE expressing tdTomato stained for RFP (white, z=2.4 µm). Counterstaining for nuclei is shown in dark blue (DAPI). White arrow in F (wild-type panel) indicates distal RPE processes around UV COS (not visible). Encircled areas show examples of phagosomes in retinas of wild-type and abca4bca33/ca33 fish. White brackets in wild-type panels A-D indicate COS. Yellow arrows indicate examples of non RPE (‘mystery’) nuclei in B and C. Scale bars: 10 µm.

Morphology of COS, ROS and RPE in retinas of 1-year-old zebrafish. (A-F) Confocal z-projections of COS, ROS and RPE in retinas obtained from wild-type or abca4aca30/ca30, abca4bca33/ca33, abca4aca30/ca30;abca4bca33/ca33 and abca4aca31/ca31;abca4bca33/ca33 mutant zebrafish. (A) Green COS stained for Green Opsin (green, z=4.3 µm), (B) red COS stained for PNA (red, z=4.3 µm), (C) blue COS stained for Blue Opsin (cyan, z=4.3 µm), (D) UV cones expressing EGFP stained for GFP (violet, z=4.4 µm;), (E) ROS stained for -rhodopsin (white, z=1.9 µm) and (F) RPE expressing tdTomato stained for RFP (white, z=2.4 µm). Nuclei (blue) were labeled with DAPI. Scale bars: 10 µm.

Quantification of COS length and number of phagosomes per COS in abca4 mutant fish aged 2 month or 1 year. (A,B) Lengths measurements of individual cone outer segment (COS) subtypes in retinas obtained from 2-month-old (A) and 1-year-old (B) wild-type (wt) or abca4aca30/ca30 (abca4a−/−), abca4bca33/ca33 (abca4b−/−), abca4aca30/ca30;abca4bca33/ca33 (abca4aca30/ca30;abca4a−/−) and abca4aca31/ca31;abca4bca33/ca33 (abca4aca31/ca31;abca4b−/−) mutant zebrafish. Data for each genotype are combined measurements from at least three eyes obtained from individual fish (individual measurements are provided in Fig. S2). Solid horizontal lines represent the mean; dashed horizontal lines indicate quartiles. (C,D) Numbers of shed COS phagosomes were normalized to the number of COS for each cone type in 2-month-old (C) or 1-year-old (D) wild-type (wt) or abca4aca30/ca30, abca4b/, abca4aca30/ca30;abca4bca33/ca33 and abca4aca31/ca31;abca4bca33/ca33 mutant fish. Each symbol represents data from an image from an eye from an individual fish; horizontal line represents the mean and vertical error bars indicate the s.e.m. *P<0.05, **P<0.01, ***P<0.001, ****P<0.0001 (one-way ANOVA, significance by Tukey's multiple comparisons test).

Photoreceptors, RPE and phagosomes in retina of young juvenile wild-type or abca4 double mutant zebrafish. (A-F) High-resolution confocal z-projections of retina obtained from wild-type or double abca4aca30/ca30;abca4bca33/ca33 mutant zebrafish at 5 weeks of age. Images show (A) green cone outer segments (COS) stained for Green Opsin (green, z=3.24 µm); (B) red COS labeled with PNA (PNA, z=4.5 µm) with distal tip bulges indicated by white arrows; (C) blue COS stained for Blue Opsin (cyan, z=4.5 µm); (D) UV cones expressing EGFP (violet, z=5 µm); (E) rod outer segments (ROS) stained for rhodopsin (white, z=2.7 µm) and (F) retinal pigmented epithelium (RPE) expressing tdTomato labeled for RFP (white, z=3.24 µm). Nuclei are shown in blue (DAPI). Scale bars: 10 µm. (G) Quantification of COS length. Solid horizontal lines represent the mean and dashed horizontal lines indicate quartiles. (H) Quantification of shed phagosomes per COS. Solid horizontal line represents the mean. *P<0.05; **P<0.01; ****P<0.0001 (Welch's t-test).

Ultrastructure of cone outer segments in retinas of wild-type and abca4 double mutant zebrafish. (A-G) TEM images of pseudo-colored COS obtained from 4-month-old wild-type or abca4−/− (abca4aca31/ca31;abca4bca33/ca33) double mutant zebrafish. Green and Red COS in retina of wild-type (A) or abca4/ (B,C) fish. Blue COS in retina of wild-type (D) or abca4/ (E) fish. UV COS in retina of wild-type (F) or abca4/ (G) fish. Scale bars: 2 µm.

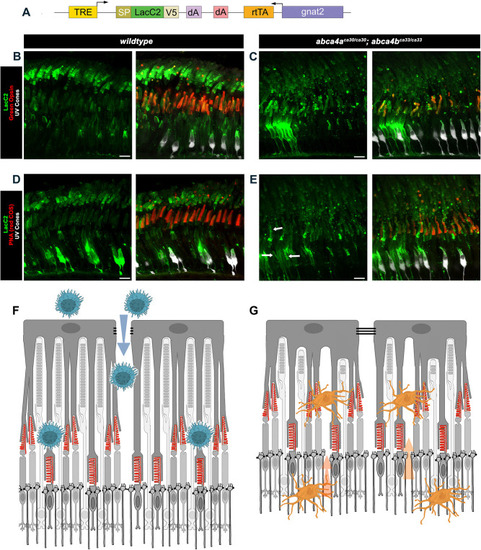
In vivo labeling of externalized phosphatidylserine. (A) Schematic of the doxycycline (DOX)-responsive V5-epitope-tagged LacC2V5 phosphatidylserine (PS)-sensitive DNA construct that was injected into single-cell wild-type or abca4ca30/ca30;abca4bca33/ca33 embryos. TRE, tetracycline response element; SP, signal peptide; gnat2, gnat2 promoter sequence; rtTA, reverse tetracycline-controlled transactivator; dA, polyA sequence. (B-E) Confocal z-projection (z=4.4 µm) images showing the photoreceptor layer in 4-month-old wild-type (B,D) or abca4ca30/ca30;abca4bca33/ca33 mutant (C,E) fish that had been treated with doxycycline for 7 days, and co-labeled for V5 (LacC2, green) and Green Opsin (red) or V5 (LacC2, green) and PNA (red) as indicated. EGFP-expressing UV cones are shown in white. (A-E) Very brightly labeled cells have incorporated the transgene, and make and secrete LacC2 protein. In the wild-type retina, LacC2 labeling smoothly coats the surface of COS and in ROS forms distinct stripes beginning at the ROS base. In the abca4a−/−;abca4b−/− double mutant retina, LacC2 labeling in COS is disrupted, with the appearance of puncti and stripes of LacC2 labeling (examples indicated by arrows in E), and ROS labeling appears less intense. Scale bars: 10 µm. (F) Schematic of how loss of RPE tight-junction (TJ) integrity in retinal degeneration diseases, like AMD, might allow macrophage (blue) infiltration, and how recognition of COS-externalized PS (indicated in red) could result in COS attack. (G) Schematic of how disruption of the outer limiting membrane (OLM) − which is formed by adherens junctions between Müller glia and photoreceptors, in retinal rod degeneration diseases, like retinitis pigmentosa − could allow microglial (orange) infiltration and recognition of the phagocytic ‘eat-me’ signal of externalized PS on COS, resulting in COS attack.

Acknowledgments
This image is the copyrighted work of the attributed author or publisher, and ZFIN has permission only to display this image to its users. Additional permissions should be obtained from the applicable author or publisher of the image. Full text @ Dis. Model. Mech.